Nanomedicine, Volume I: Basic Capabilities
© 1999 Robert A. Freitas Jr. All Rights Reserved.
Robert A. Freitas Jr., Nanomedicine, Volume I: Basic Capabilities, Landes Bioscience, Georgetown, TX, 1999
List of Figures
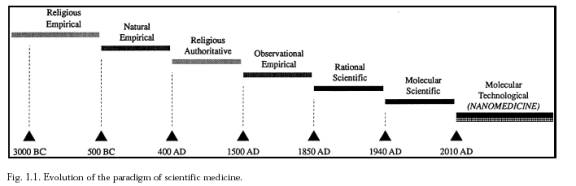
Figure 1.1. Evolution of the Paradigm of Scientific Medicine
Figure 1.2. Deaths Due to Diphtheria in England and Wales
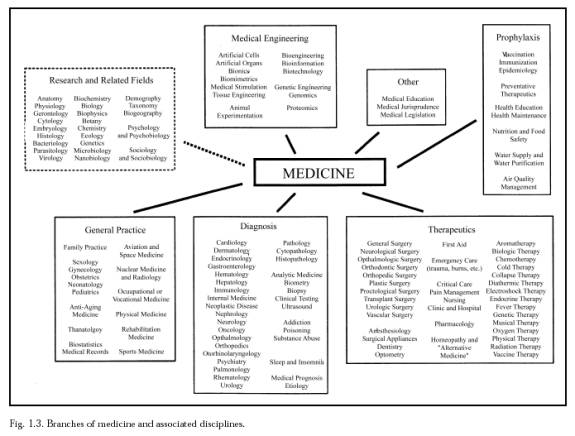
Figure 1.3. Branches of Medicine and Associated Disciplines
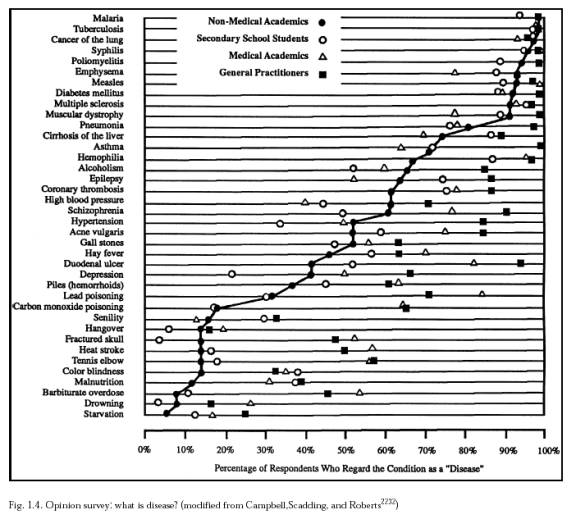
Figure 1.4. Opinion Survey: What Is "Disease"?
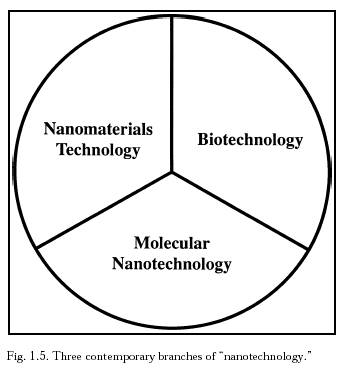
Figure 1.5. Three Contemporary Branches of "Nanotechnology"
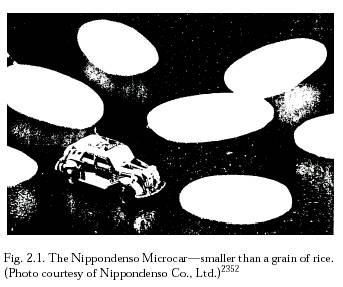
Figure 2.1. The Nippondenso Microcar -- Smaller Than A Grain of Rice
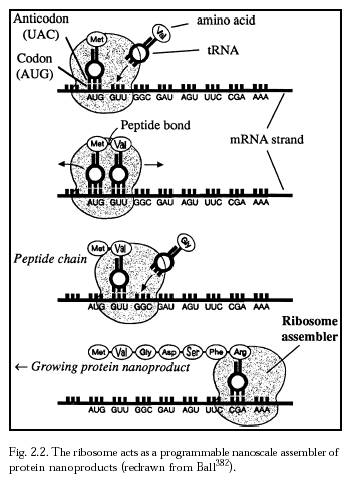
Figure 2.2. The Ribosome Acts as a Programmable Nanoscale Assembler of Protein Nanoproducts
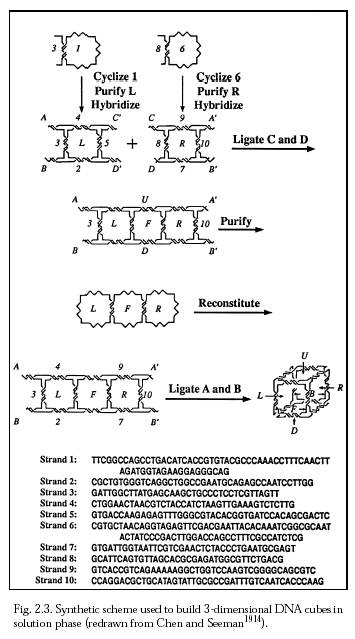
Figure 2.3. Synthetic Scheme Used to Build 3-Dimensional DNA Cubes in Solution Phase
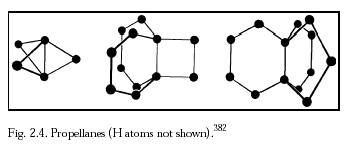
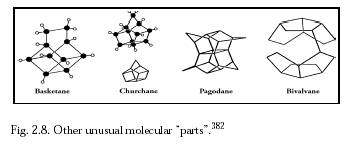
Figure 2.8. Other Unusual Molecular "Parts"
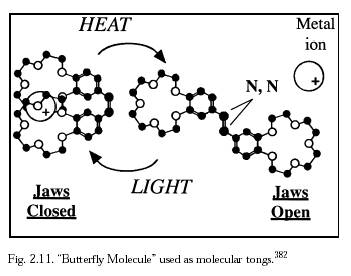
Figure 2.11. "Butterfly Molecule" Used as Molecular Tongs
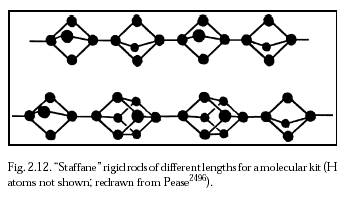
Figure 2.12. "Staffane" Rigid Rods of Different Lengths for a Molecular Construction Kit
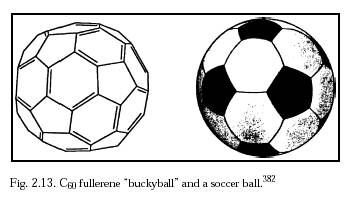
Figure 2.13. C60 Fullerene "Buckyball" and a Soccer Ball
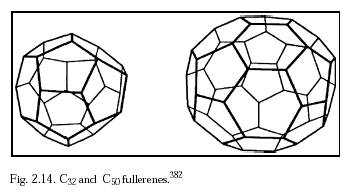
Figure 2.14. C32 and C50 Fullerenes
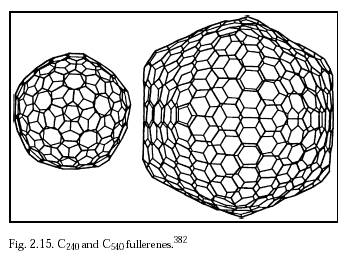
Figure 2.15. C240 and C540 Fullerenes
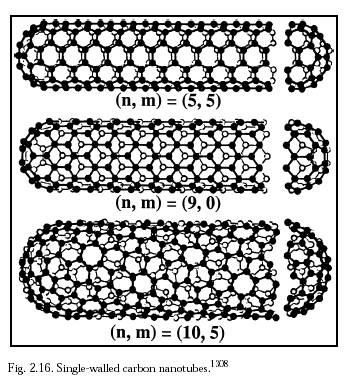
Figure 2.16. Single-Walled Carbon Nanotubes
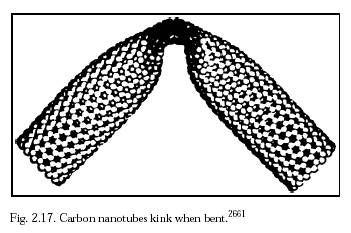
Figure 2.17. Carbon Nanotubes Kink When Bent
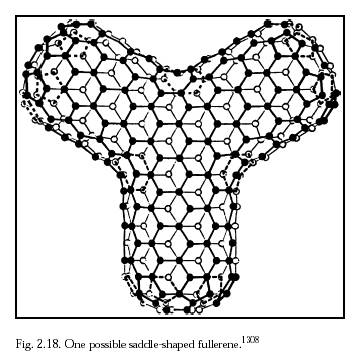
Figure 2.18. One Possible Saddle-Shaped Fullerene
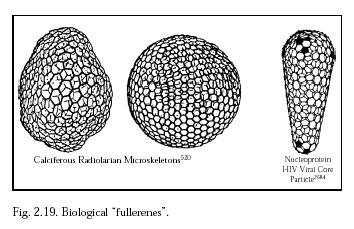
Figure 2.19. Biological "Fullerenes"
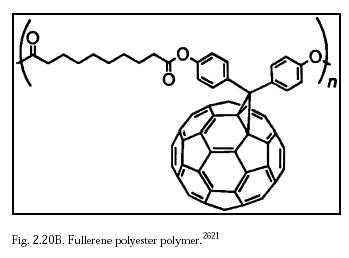
Figure 2.20B. Fullerene Polyester Polymer
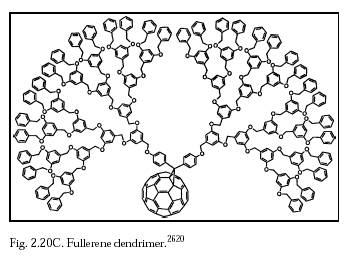
Figure 2.20C. Fullerene Dendrimer
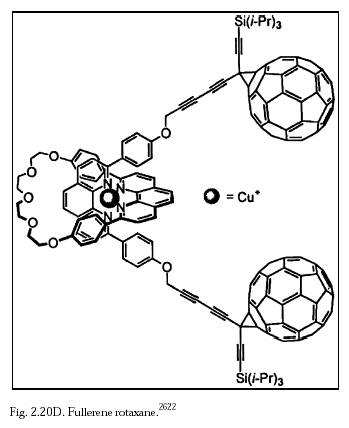
Figure 2.20D. Fullerene Rotaxane
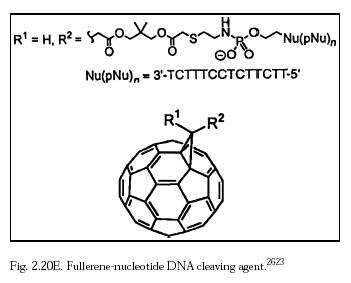
Figure 2.20E. Fullerene-Nucleotide DNA Cleaving Agent
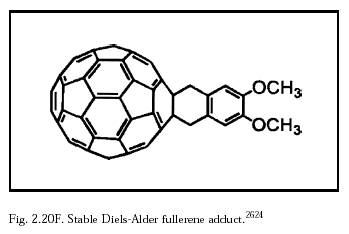
Figure 2.20F. Stable Diels-Alder Fullerene Adduct
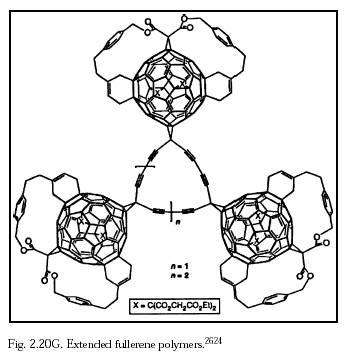
Figure 2.20G. Extended Fullerene Polymers
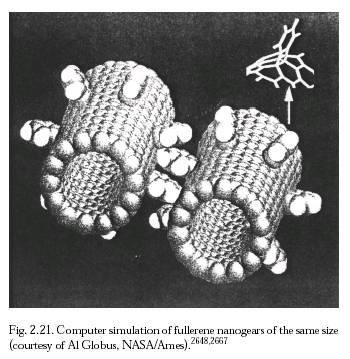
Figure 2.21. Computer Simulation of Fullerene Nanogears of the Same Size
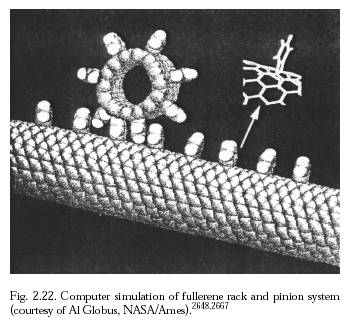
Figure 2.22. Computer Simulation of Fullerene Rack and Pinion System
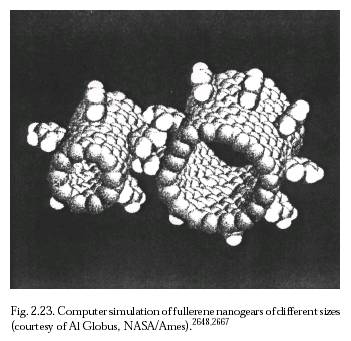
Figure 2.23. Computer Simulation of Fullerene Nanogears of Different Sizes
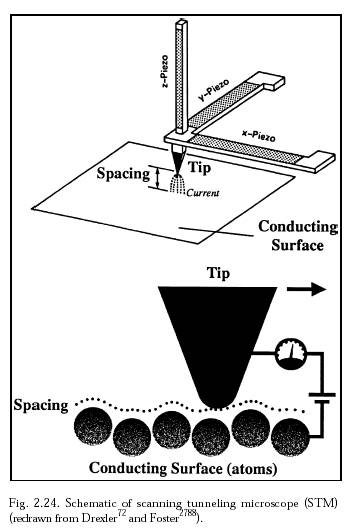
Figure 2.24. Schematic of Scanning Tunneling Microscope (STM)
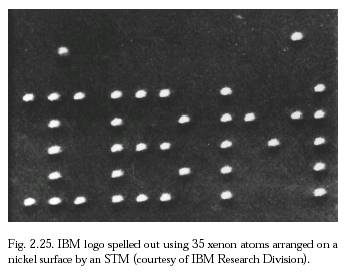
Figure 2.25. IBM Logo Spelled Out Using 35 Xenon Atoms Arranged on a Nickel Surface by an STM
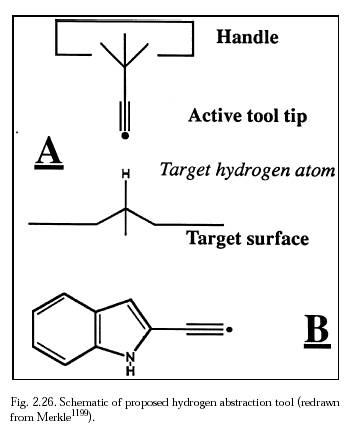
Figure 2.26. Schematic of Proposed Hydrogen Abstraction Tool
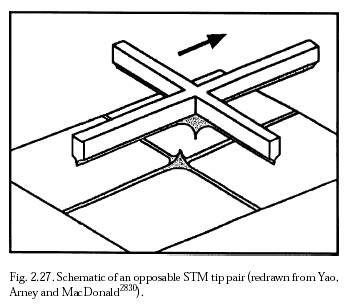
Figure 2.27. Schematic of an Opposable STM Tip Pair
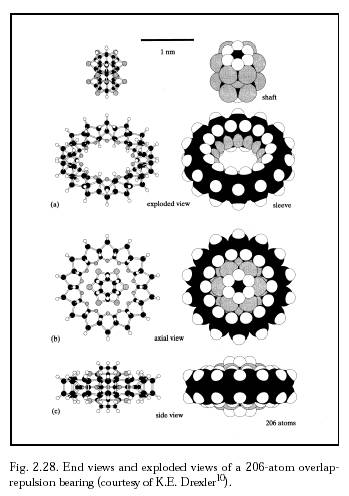
Figure 2.28. End Views and Exploded Views of a 206-atom Overlap-Repulsion Bearing
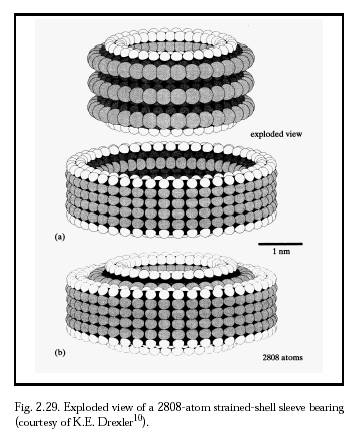
Figure 2.29. Exploded View of a 2808-atom Strained-Shell Sleeve Bearing
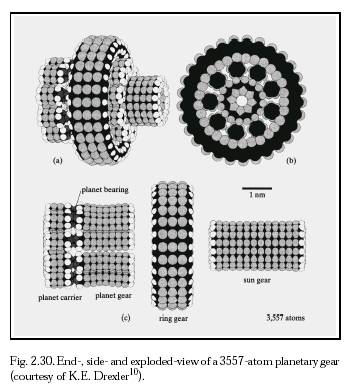
Figure 2.30. End-, Side-, and Exploded-View of a 3557-atom Planetary Gear
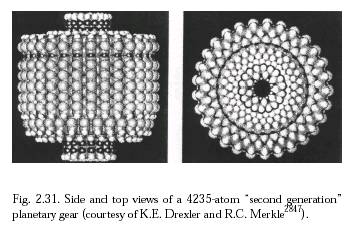
Figure 2.31. Side and Top Views of a 4235-atom "Second Generation" Planetary Gear
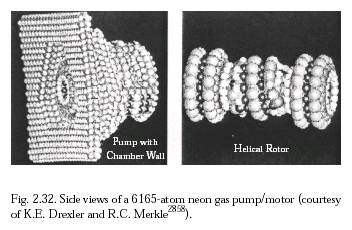
Figure 2.32. Side Views of a 6165-atom Neon Gas Pump/Motor
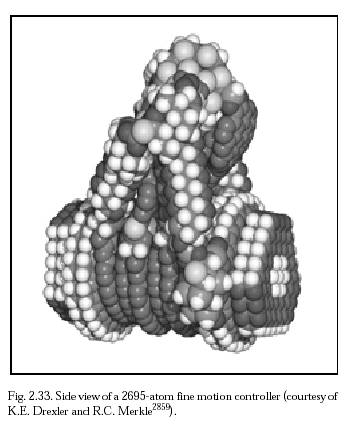
Figure 2.33. Side View of a 2596-atom Fine Motion Controller
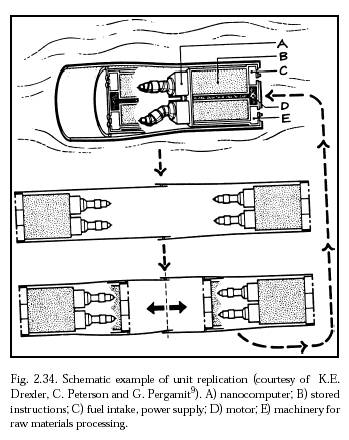
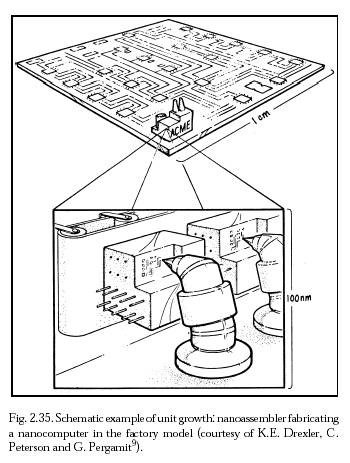
Figure 2.34. Schematic Example of Unit Replication
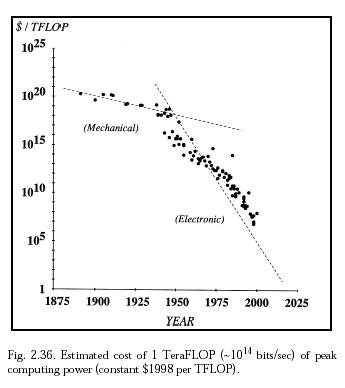
Figure 2.36. Estimated Cost of 1 TeraFLOP (~1014 bits/sec) of Peak Computing Power
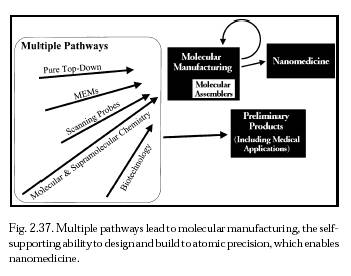
Figure 2.37. Multiple Pathways Lead to Molecular Manufacturing
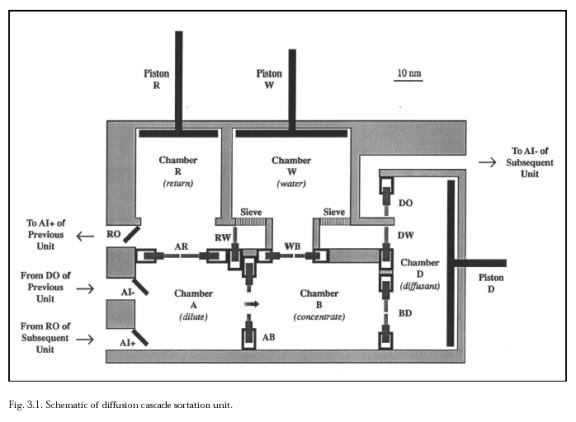
Figure 3.1. Schematic of Diffusion Cascade Sortation Unit
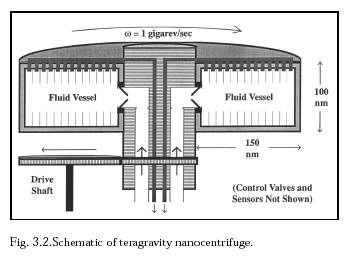
Figure 3.2. Schematic of Teragravity Nanocentrifuge
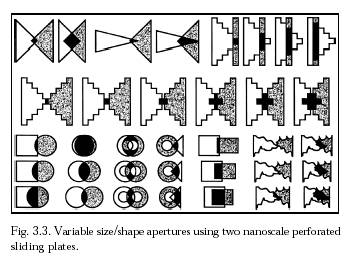
Figure 3.3. Variable Size/Shape Apertures Using Two Nanoscale Perforated Sliding Plates
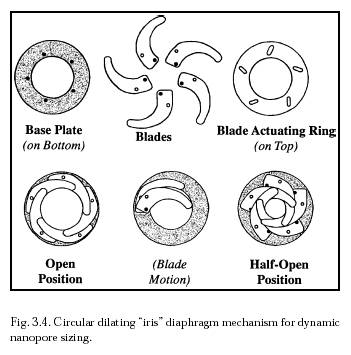
Figure 3.4. Circular Dilating "Iris" Diaphragm Mechanism for Dynamic Pore Sizing
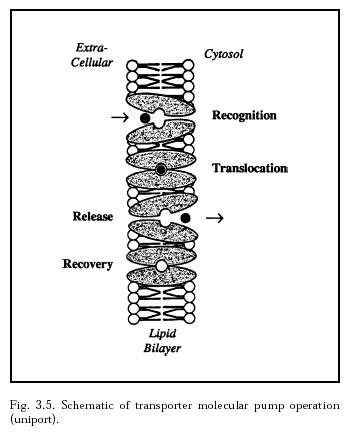
Figure 3.5. Schematic of Transporter Molecular Pump Operation (Uniport)
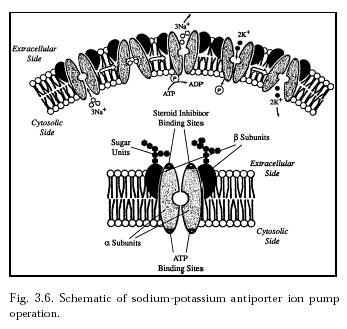
Figure 3.6. Schematic of Sodium-Potassium Antiporter Ion Pump Operation
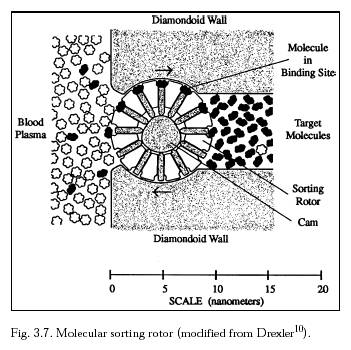
Figure 3.7. Molecular Sorting Rotor
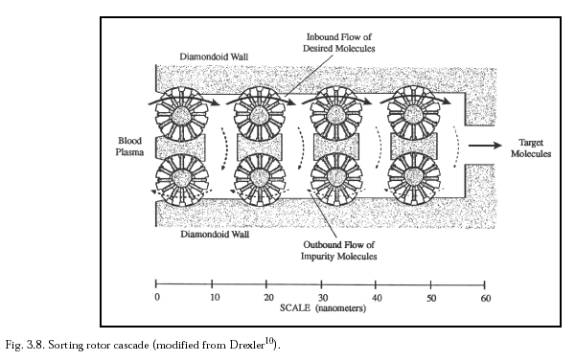
Figure 3.8. Sorting Rotor Cascade
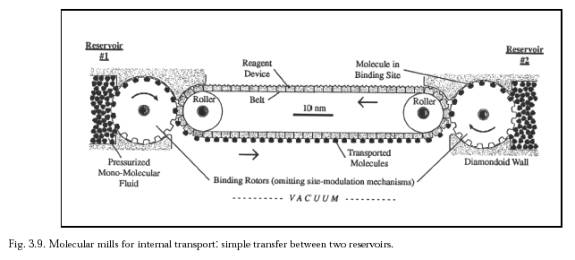
Figure 3.9. Molecular Mills for Internal Transport: Simple Transfer Between Two Reservoirs
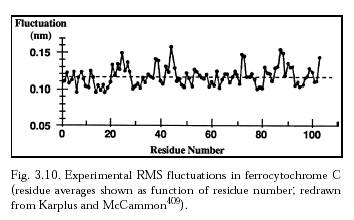
Figure 3.10. Experimental RMS Fluctuations in Ferrocytochrome C
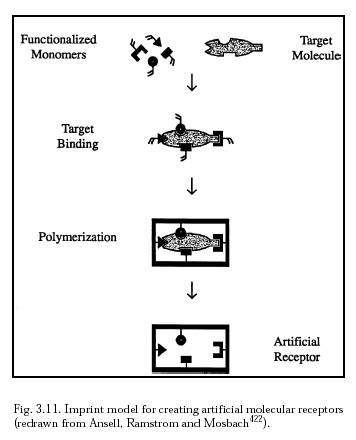
Figure 3.11. Imprint Model for Creating Artificial Molecular Receptors
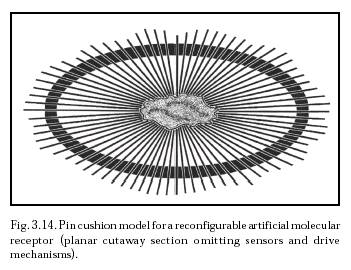
Figure 3.14. Pin Cushion Model for a Reconfigurable Artificial Molecular Receptor
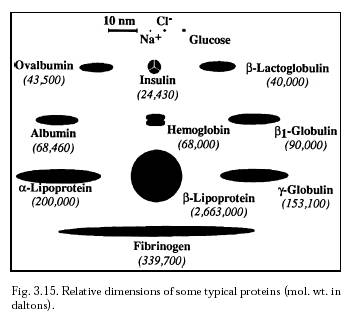
Figure 3.15. Relative Dimensions of Some Typical Proteins
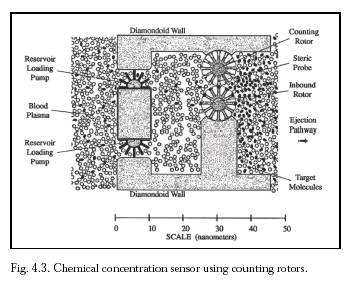
Figure 4.3. Chemical Concentration Sensor Using Counting Rotors
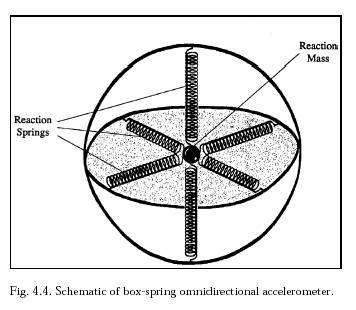
Figure 4.4. Schematic of Box-Spring Omnidirectional Accelerometer
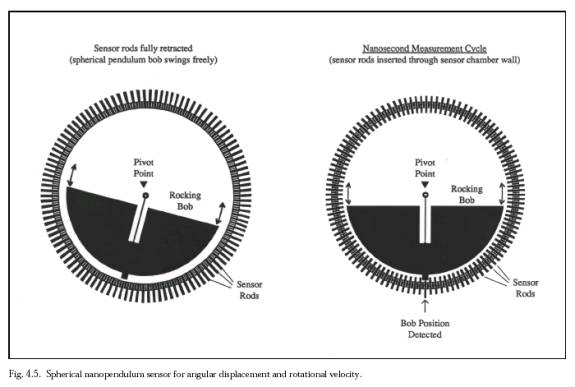
Figure 4.5. Spherical Nanopendulum Sensor for Angular Displacement and Rotational Velocity
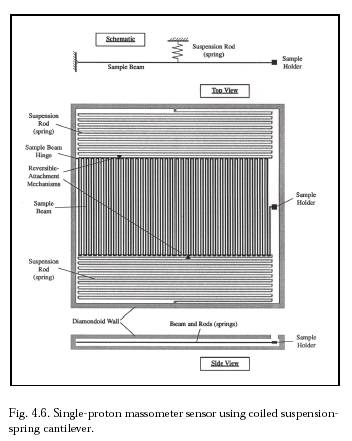
Figure 4.6. Single-Proton Massometer Sensor Using Coiled Suspension-Spring Cantilever
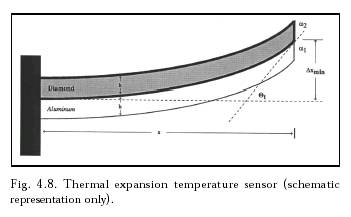
Figure 4.8. Thermal Expansion Temperature Sensor
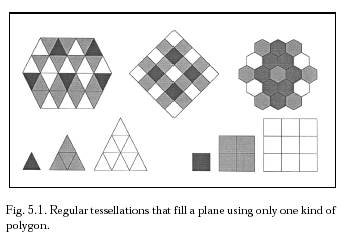
Figure 5.1. Regular Tessellations that Fill A Plane Using Only One Kind of Polygon
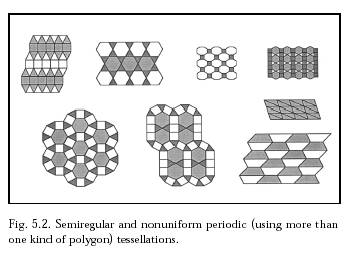
Figure 5.2. Semiregular and Nonuniform Periodic (Using More Than One Kind of Polygon) Tessellations
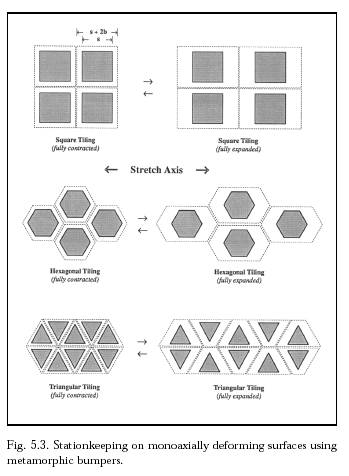
Figure 5.3. Stationkeeping on Monoaxially Deforming Surfaces Using Metamorphic Bumpers
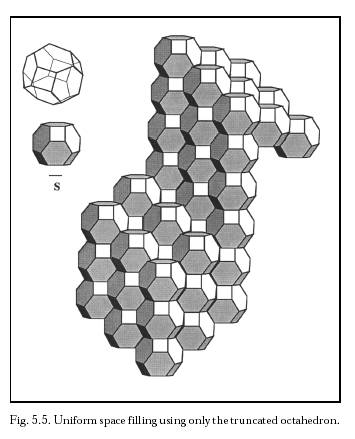
Figure 5.5. Uniform Space Filling Using Only the Truncated Octahedron
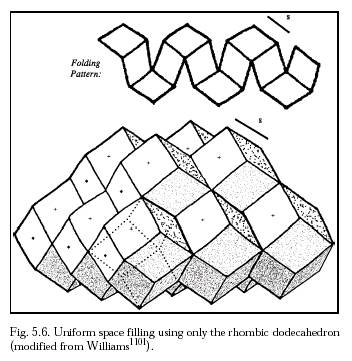
Figure 5.6. Uniform Space Filling Using Only the Rhombic Dodecahedron
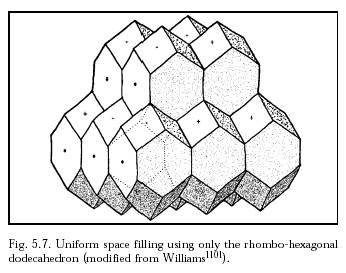
Figure 5.7. Uniform Space Filling Using Only the Rhombo-Hexagonal Dodecahedron
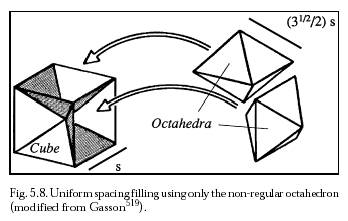
Figure 5.8. Uniform Space Filling Using Only the Non-Regular Octahedron
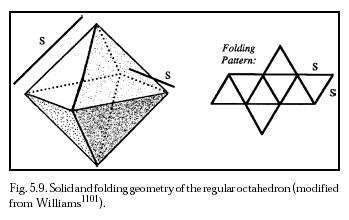
Figure 5.9. Solid and Folding Geometry of the Regular Octahedron
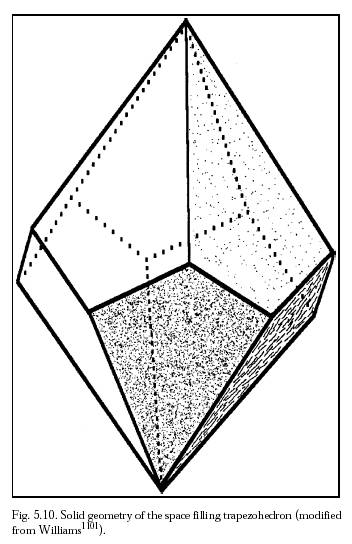
Figure 5.10. Solid Geometry of the Space Filling Trapezohedron
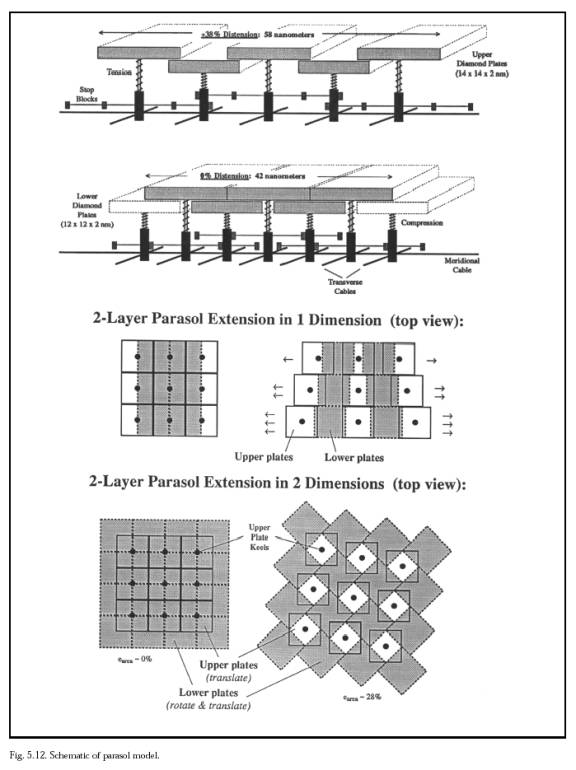
Figure 5.12. Schematic of Parasol Model
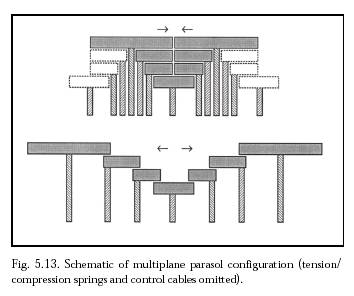
Figure 5.13. Schematic of Multiplane Parasol Configuration
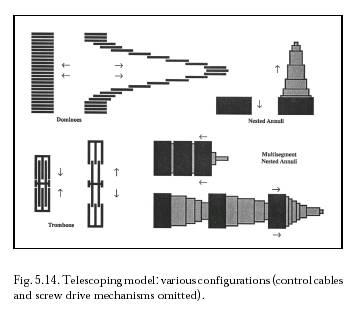
Figure 5.14. Telescoping Model: Various Configurations
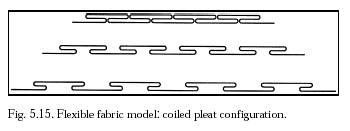
Figure 5.15. Flexible Fabric Model: Coiled Pleat Configuration
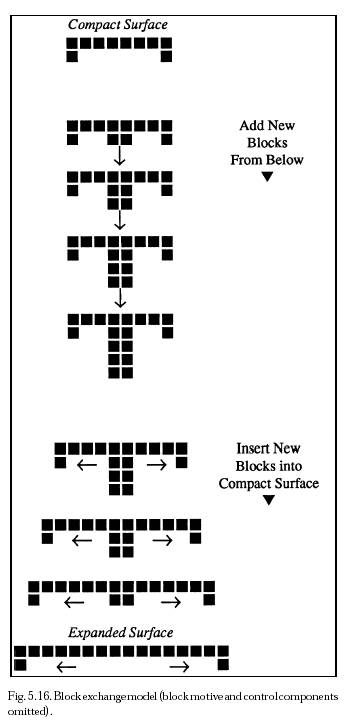
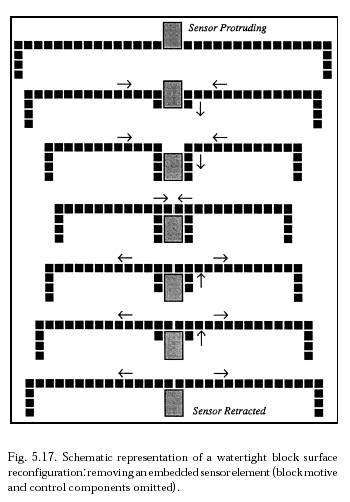
Figure 5.16. Block Exchange Model
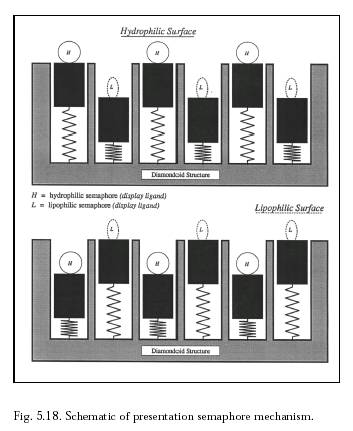
Figure 5.18. Schematic of Presentation Semaphore Mechanism
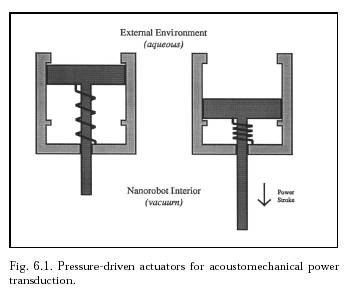
Figure 6.1 Pressure-Driven Actuators for Acoustomechanical Power Transduction
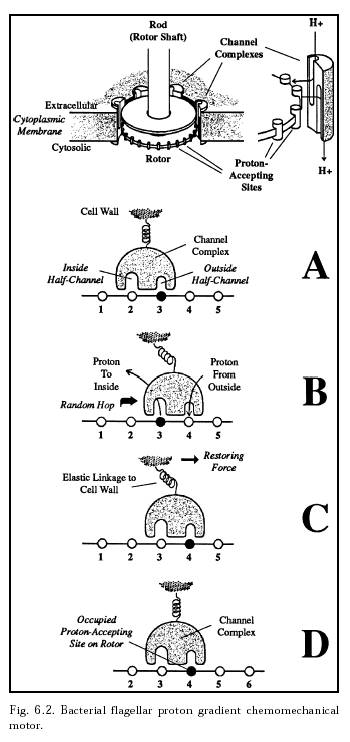
Figure 6.2. Bacterial Flagellar Proton Gradient Chemomechanical Motor
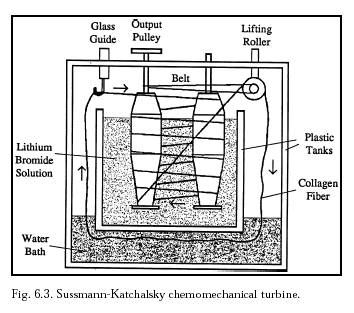
Figure 6.3. Sussmann-Katchalsky Chemomechanical Turbine
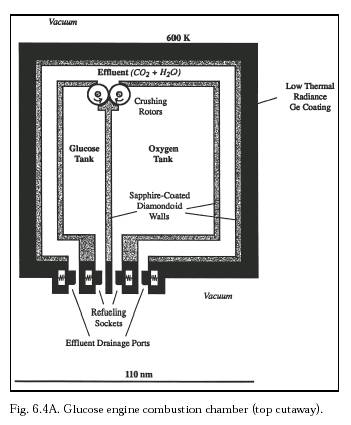
Figure 6.4A. Glucose Engine Combustion Chamber (top cutaway)
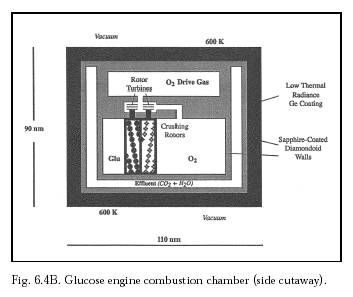
Figure 6.4B. Glucose Engine Combustion Chamber (side cutaway)
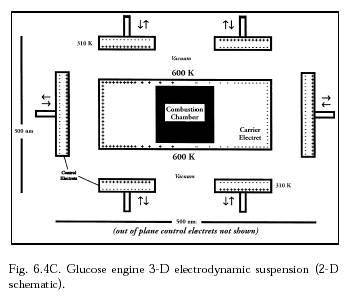
Figure 6.4C. Glucose Engine 3-D Electrodynamic Suspension (2-D schematic)
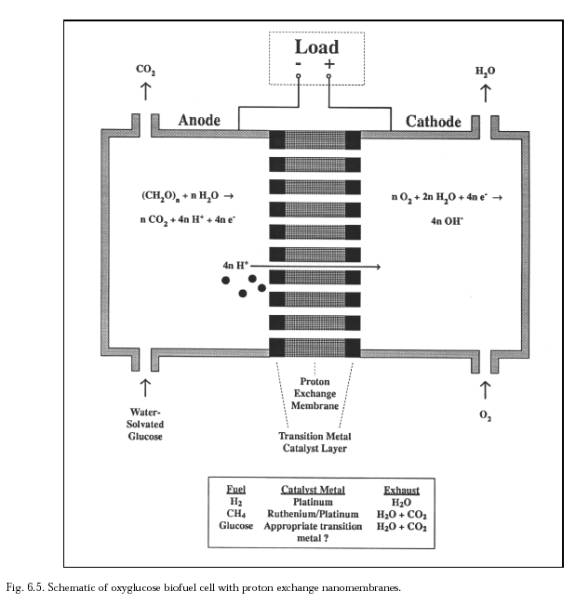
Figure 6.5. Schematic of Oxyglucose Biofuel Cell with Proton Exchange Nanomembrane
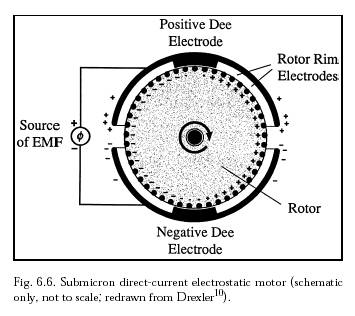
Figure 6.6. Submicron Direct-Current Electrostatic Motor
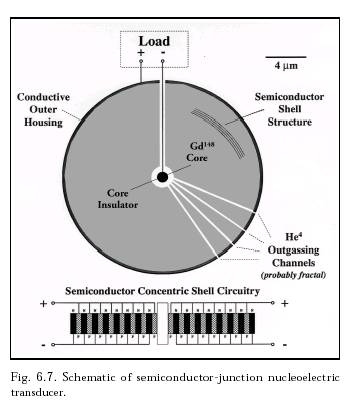
Figure 6.7. Schematic of Semiconductor-Junction Nucleoelectric Transducer
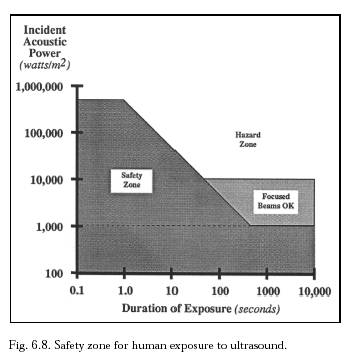
Figure 6.8. Safety Zone for Human Exposure to Ultrasound
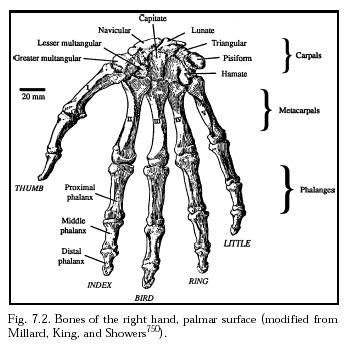
Figure 7.2. Bones of the Right Hand, Palmar Surface
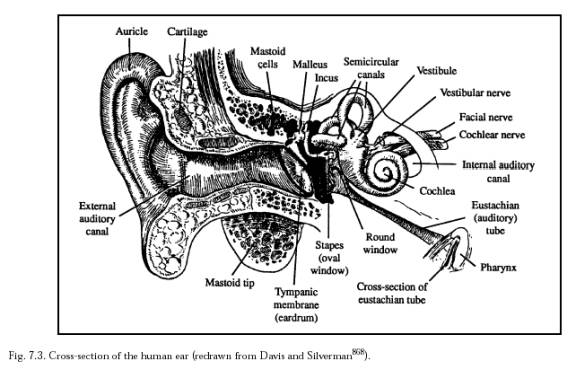
Figure 7.3. Cross-Section of the Human Ear
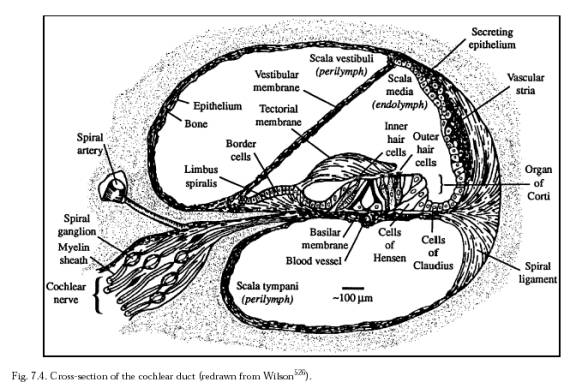
Figure 7.4. Cross-Section of the Cochlear Duct
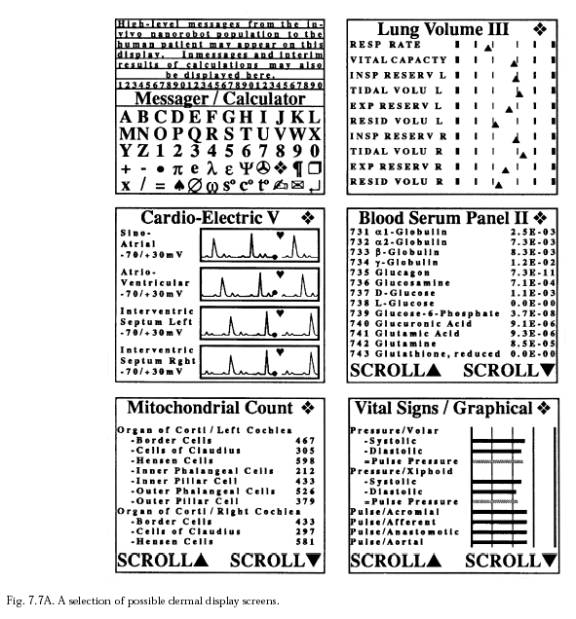
Figure 7.7A. A Selection of Possible Dermal Display Screens
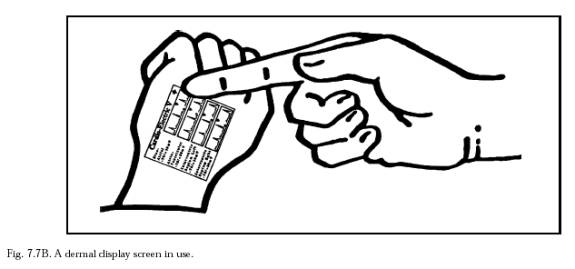
Figure 7.7B. A Dermal Display Screen in Use
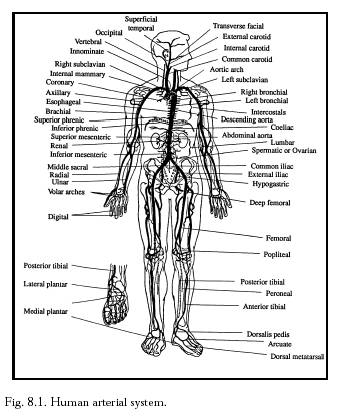
Figure 8.1. Human Arterial System
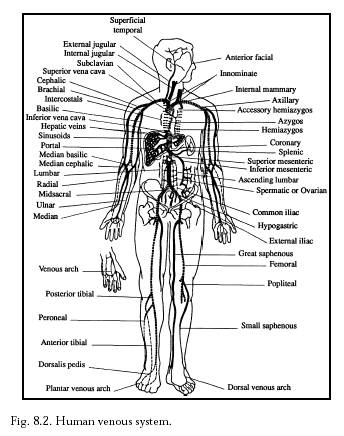
Figure 8.2. Human Venous System
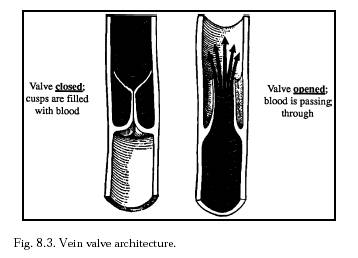
Figure 8.3. Vein Valve Architecture
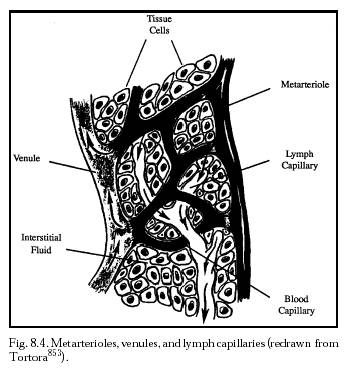
Figure 8.4. Metarterioles, Venules, and Lymph Capillaries
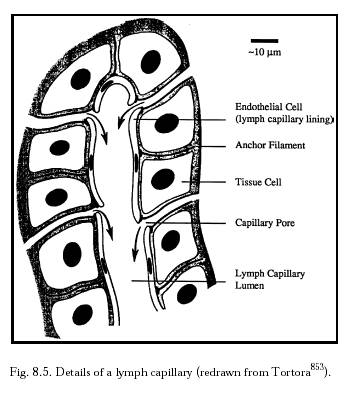
Figure 8.5. Details of a Lymph Capillary
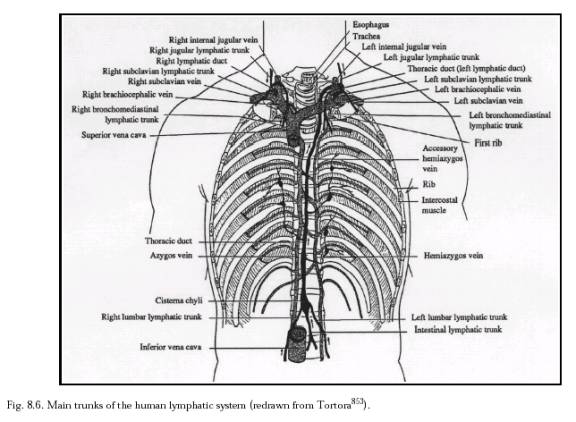
Figure 8.6. Main Trunks of the Human Lymphatic System
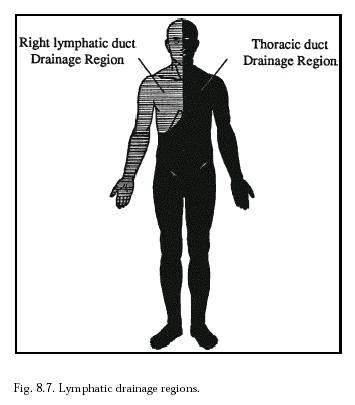
Figure 8.7. Lymphatic Drainage Regions
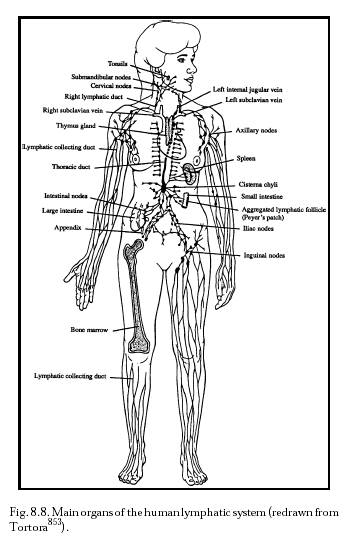
Figure 8.8. Main Organs of the Human Lymphatic System
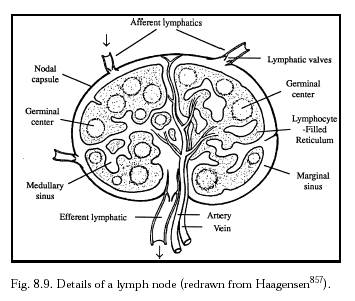
Figure 8.9. Details of a Lymph Node
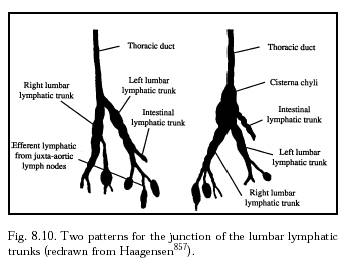
Figure 8.10. Two Patterns for the Junction of the Lumbar Lymphatic Trunks
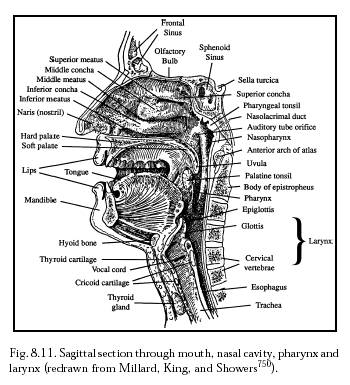
Figure 8.11. Sagittal Section Through Mouth, Nasal Cavity, Pharynx and Larynx
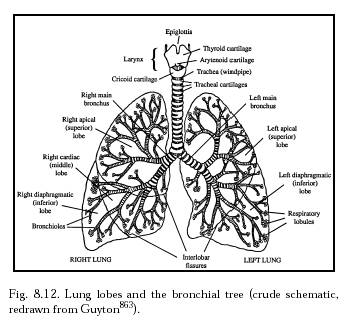
Figure 8.12. Lung Lobes and the Bronchial Tree
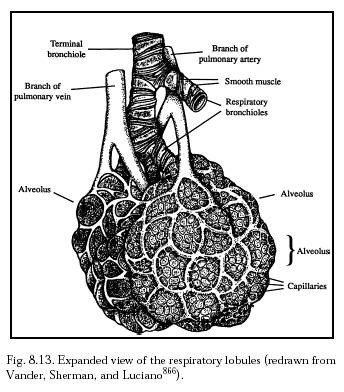
Figure 8.13. Expanded View of the Respiratory Lobules
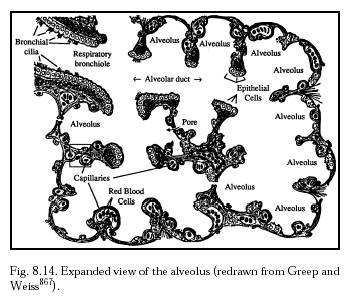
Figure 8.14. Expanded View of the Alveolus
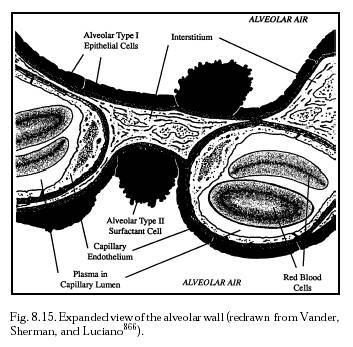
Figure 8.15. Expanded View of the Alveolar Wall
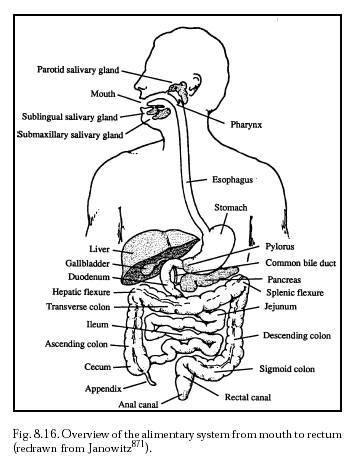
Figure 8.16. Overview of the Alimentary System from Mouth to Rectum
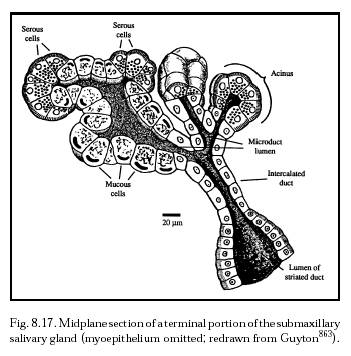
Figure 8.17. Midplane Section of a Terminal Portion of the Submaxillary Salivary Gland
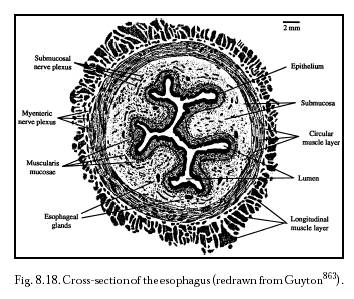
Figure 8.18. Cross-Section of the Esophagus
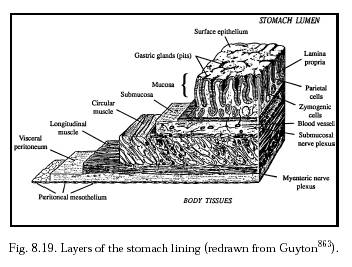
Figure 8.19. Layers of the Stomach Lining
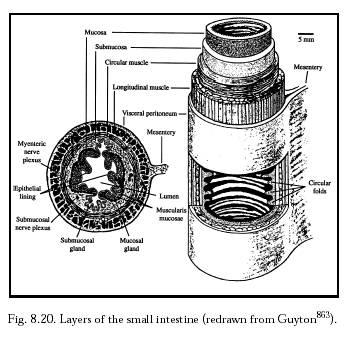
Figure 8.20. Layers of the Small Intestine
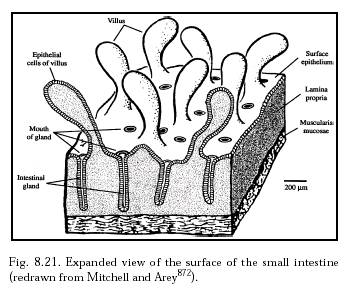
Figure 8.21. Expanded View of the Surface of the Small Intestine
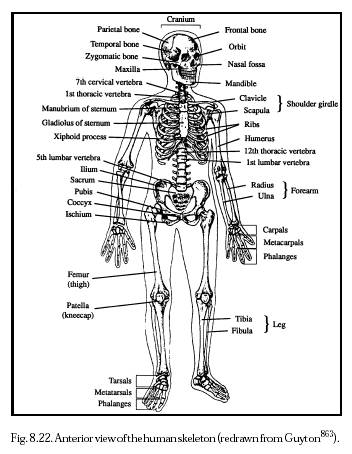
Figure 8.22. Anterior View of the Human Skeleton
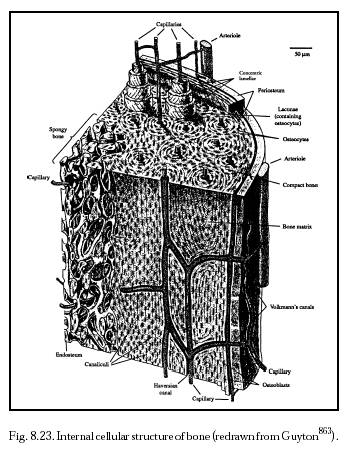
Figure 8.23. Internal Cellular Structure of Bone
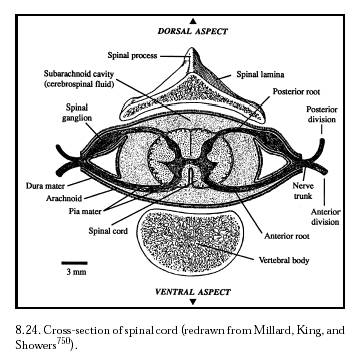
Figure 8.24. Cross-Section of Spinal Cord
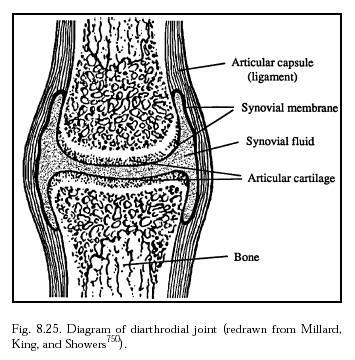
Figure 8.25. Diagram of Diarthrodial Joint
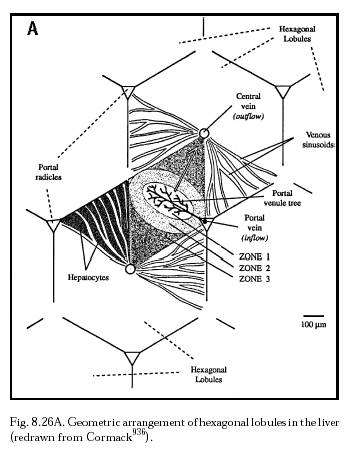
Figure 8.26A. Geometric Arrangement of Hexagonal Lobules in the Liver
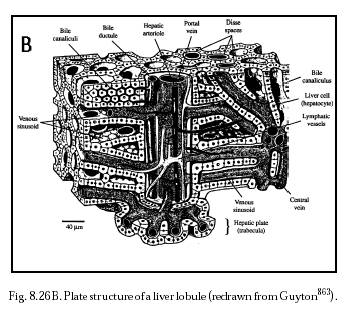
Figure 8.26B. Plate Structure of a Liver Lobule
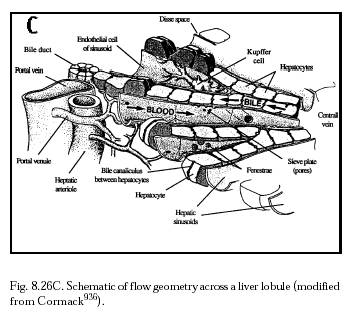
Figure 8.26C. Schematic of Flow Geometry Across a Liver Lobule
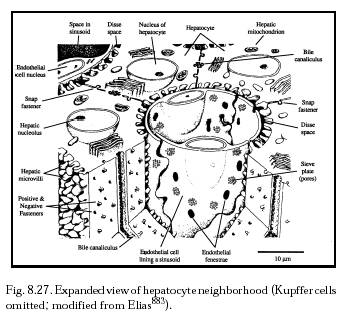
Figure 8.27. Expanded View of Hepatocyte Neighborhood
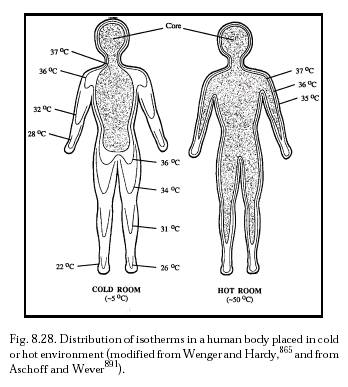
Figure 8.28. Distribution of Isotherms in a Human Body Placed in Cold or Hot Environment
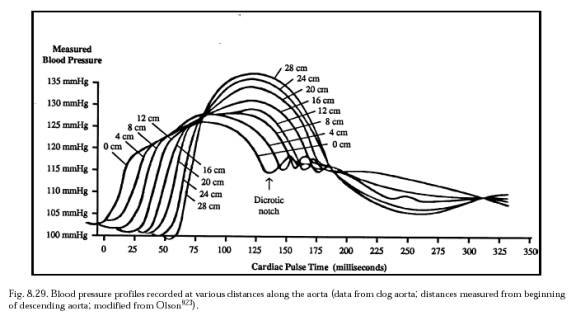
Figure 8.29. Blood Pressure Profiles Recorded at Various Distances Along the Aorta
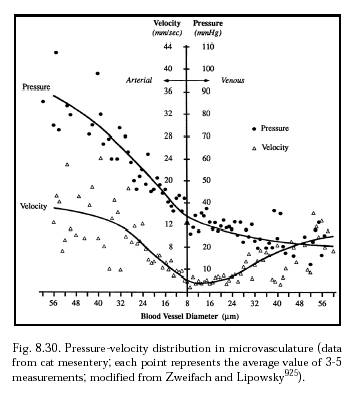
Figure 8.30. Pressure-Velocity Distribution in Microvasculature
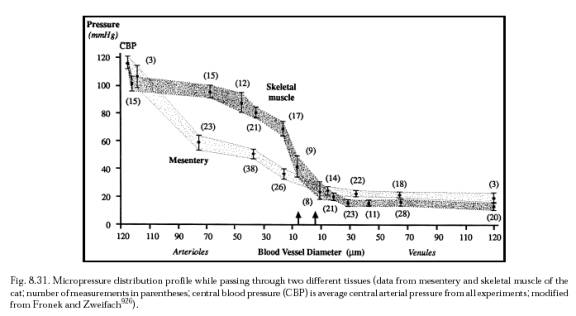
Figure 8.31. Micropressure Distribution Profile While Passing Through Two Different Tissues
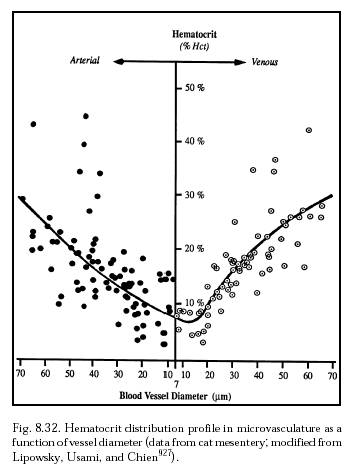
Figure 8.32. Hematocrit Distribution Profile in Microvasculature as a Function of Vessel Diameter
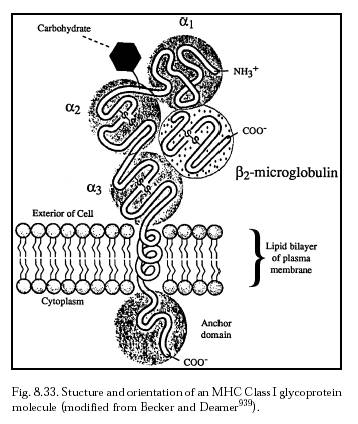
Figure 8.33. Structure and Orientation of an MHC Class I Glycoprotein Molecule
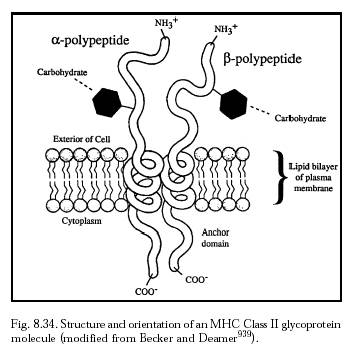
Figure 8.34. Structure and Orientation of an MHC Class II Glycoprotein Molecule
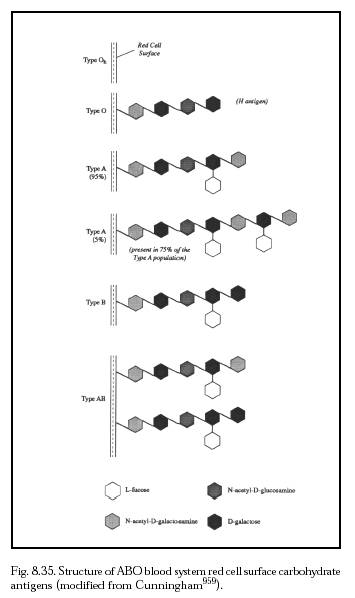
Figure 8.35. Structure of ABO Blood System Red Cell Surface Carbohydrate Antigens
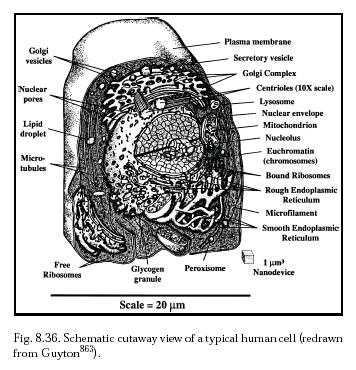
Figure 8.36. Schematic Cutaway View of a Typical Human Cell
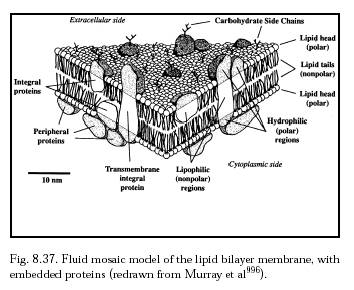
Figure 8.37. Fluid Mosaic Model of the Lipid Bilayer Membrane, with Embedded Proteins
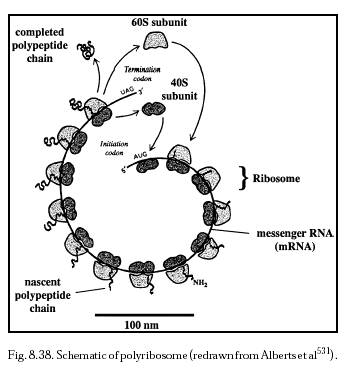
Figure 8.38. Schematic of Polyribosome
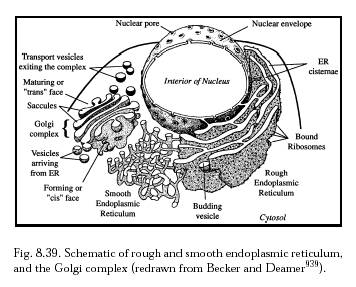
Figure 8.39. Schematic of Rough and Smooth Endoplasmic Reticulum, and the Golgi Complex
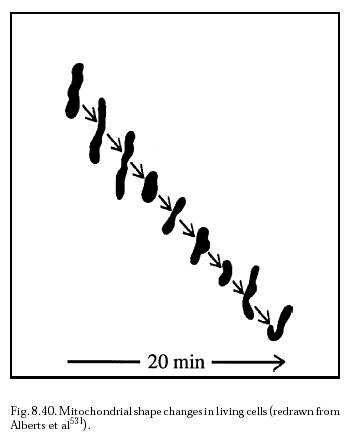
Figure 8.40. Mitochondrial Shape Changes in Living Cells
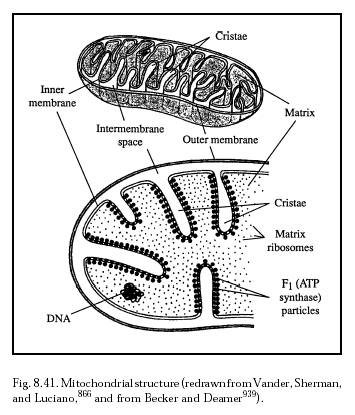
Figure 8.41. Mitochondrial Structure
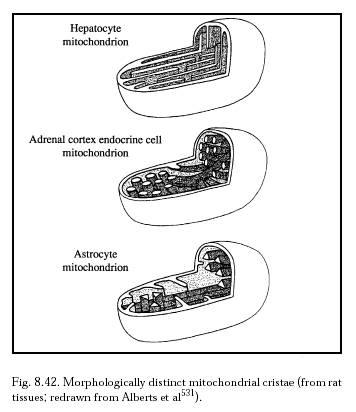
Figure 8.42. Morphologically Distinct Mitochondrial Cristae
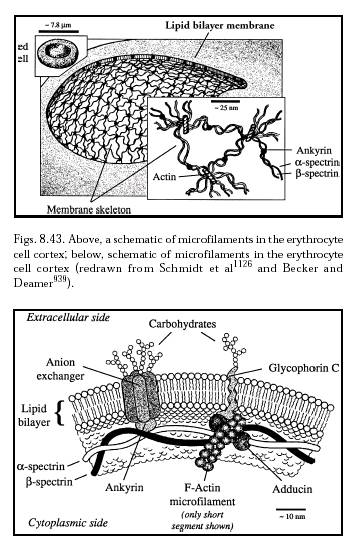
Figure 8.43. Schematic of Microfilaments in the Erythrocyte Cell Cortex
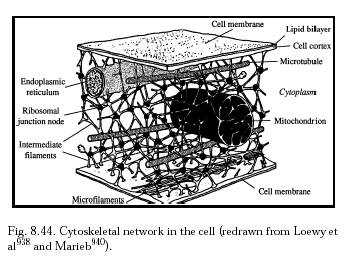
Figure 8.44. Cytoskeletal Network in the Cell
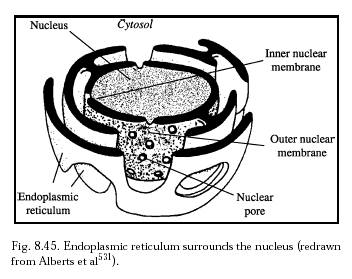
Figure 8.45. Endoplasmic Reticulum Surrounds the Nucleus
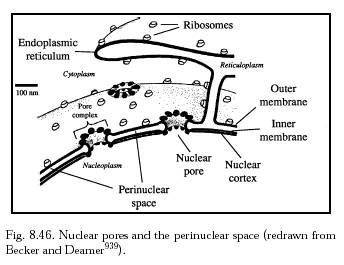
Figure 8.46. Nuclear Pores and the Perinuclear Space
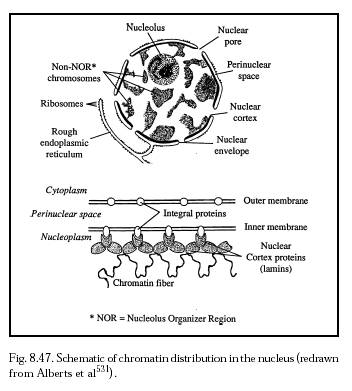
Figure 8.47. Schematic of Chromatin Distribution in the Nucleus
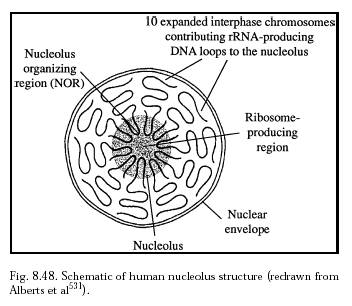
Figure 8.48. Schematic of Human Nucleolus Structure
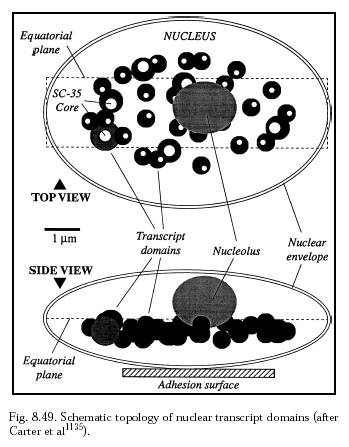
Figure 8.49. Schematic Topology of Nuclear Transcript Domains
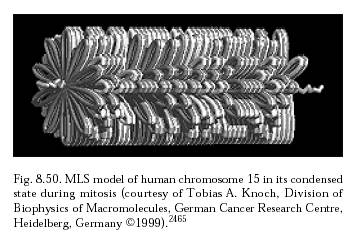
Figure 8.50. MLS Model of Human Chromosome 15 in Its Condensed State During Mitosis
Figure 8.51. Human Chromosome 15 in Its Relaxed State Between Cell Divisions
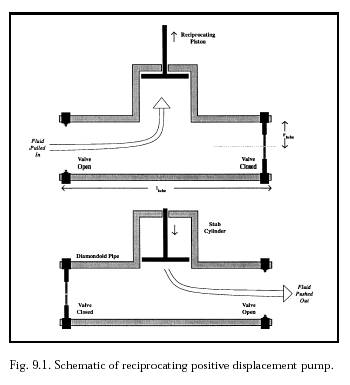
Figure 9.1. Schematic of Reciprocating Positive Displacement Pump
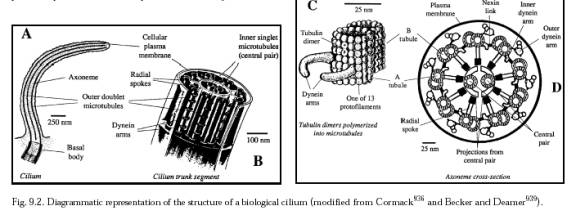
Figure 9.2. Diagrammatic Representation of the Structure of a Biological Cilium
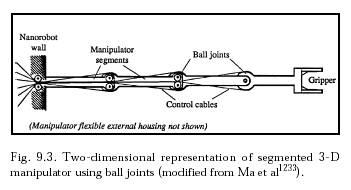
Figure 9.3. Two-Dimensional Representation of Segmented 3-D Manipulator Using Ball Joints
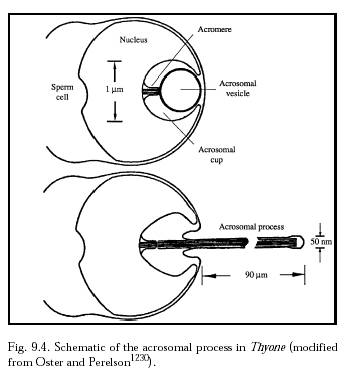
Figure 9.4. Schematic of the Acrosomal Process in Thyone
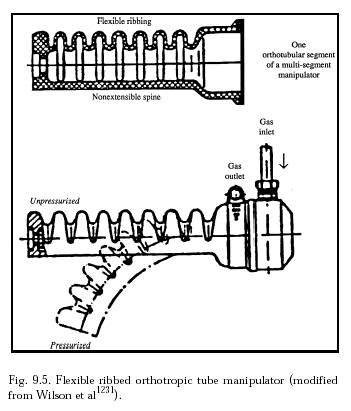
Figure 9.5. Flexible Ribbed Orthotropic Tube Manipulator
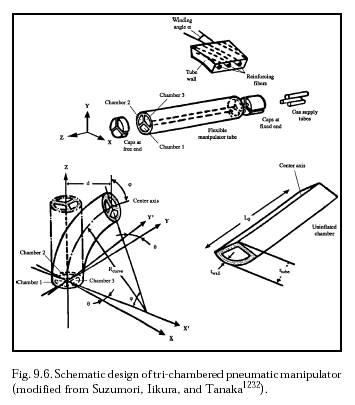
Figure 9.6. Schematic Design of Tri-Chambered Pneumatic Manipulator
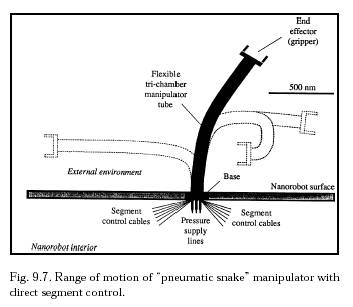
Figure 9.7. Range of Motion of "Pneumatic Snake" Manipulator with Direct Segment Control
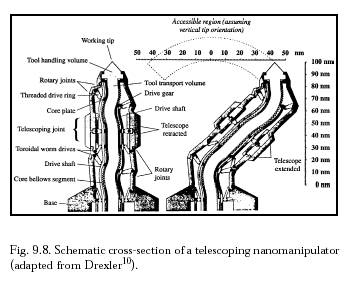
Figure 9.8. Schematic Cross-Section of a Telescoping Nanomanipulator
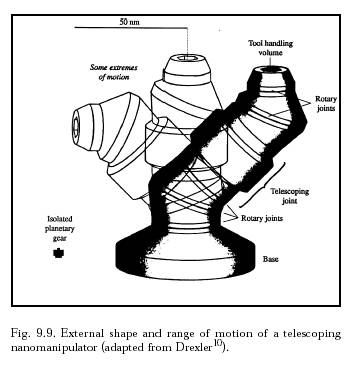
Figure 9.9. External Shape and Range of Motion of a Telescoping Nanomanipulator
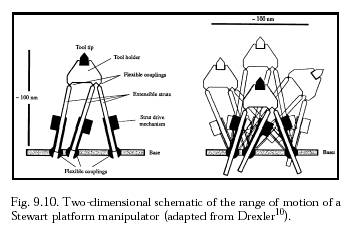
Figure 9.10. Two-Dimensional Schematic of the Range of Motion of a Stewart Platform Manipulator
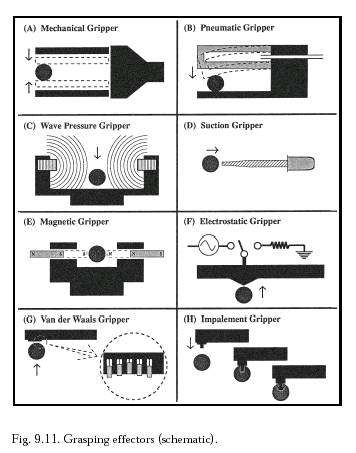
Figure 9.11. Grasping Effectors (schematic)
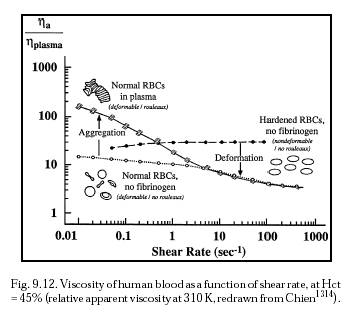
Figure 9.12. Viscosity of Human Blood as a Function of Shear Rat, at Hct = 45%
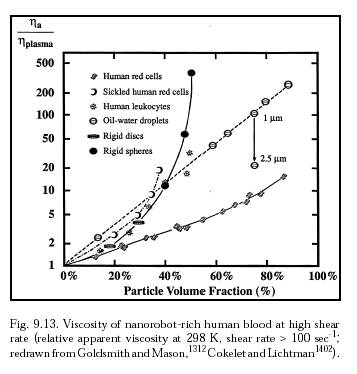
Figure 9.13. Viscosity of Nanorobot-Rich Human Blood at High Shear Rate
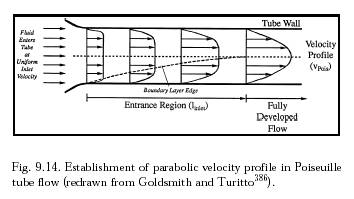
Figure 9.14. Establishment of Parabolic Velocity Profile in Poiseuille Tube Flow
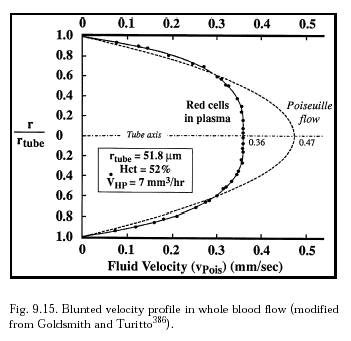
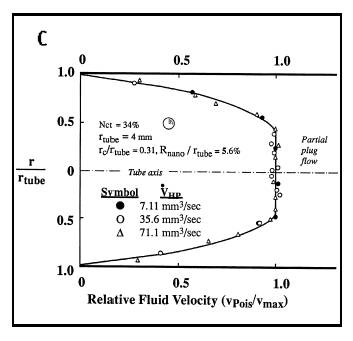
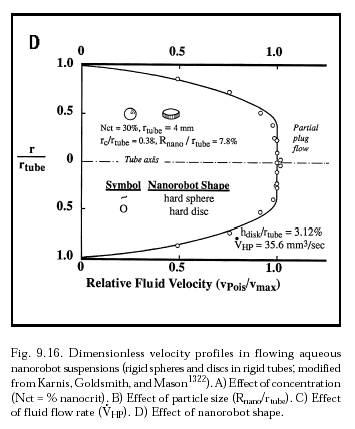
Figure 9.15. Blunted Velocity Profile in Whole Blood Flow
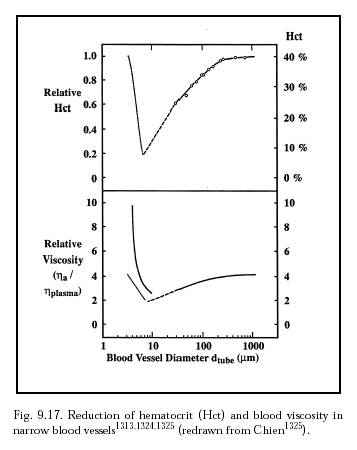
Figure 9.17. Reduction of Hematocrit (Hct) and Blood Viscosity in Narrow Blood Vessels
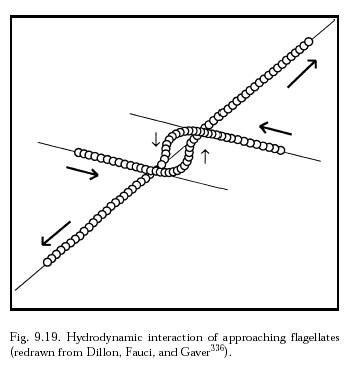
Figure 9.19. Hydrodynamic Interaction of Approaching Flagellates
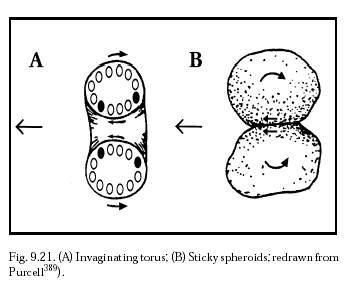
Figure 9.21A. Invaginating Torus
Figure 9.21B. Sticky Spheroids
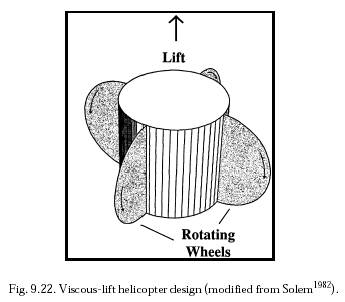
Figure 9.22. Viscous-Lift Helicopter Design
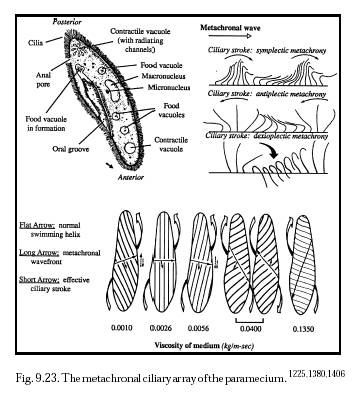
Figure 9.23. The Metachronal Ciliary Array of the Paramecium
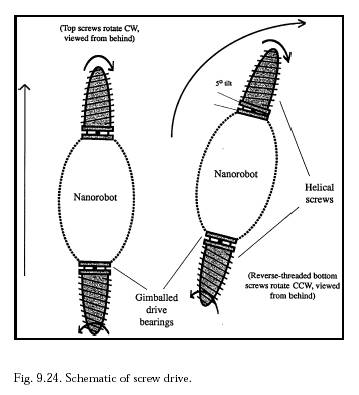
Figure 9.24. Schematic of Screw Drive
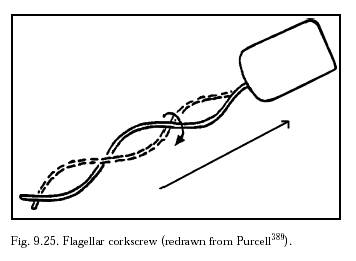
Figure 9.25. Flagellar Corkscrew
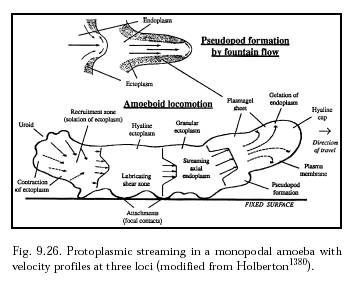
Figure 9.26. Protoplasmic Streaming in a Monopodal Amoeba with Velocity Profiles at Three Loci
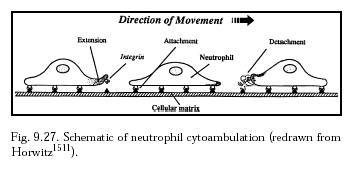
Figure 9.27. Schematic of Neutrophil Cytoambulation
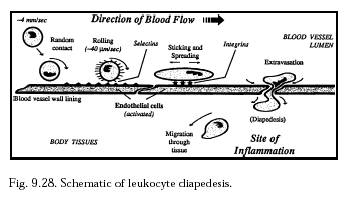
Figure 9.28. Schematic of Leukocyte Diapedesis
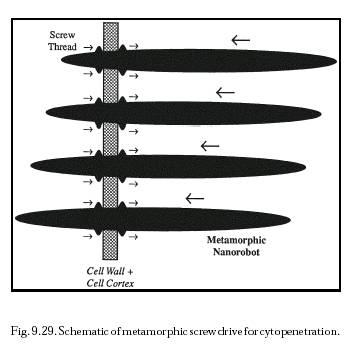
Figure 9.29. Schematic of Metamorphic Screw Drive for Cytopenetration
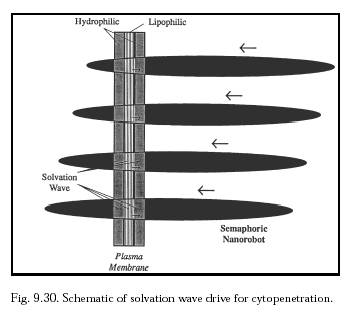
Figure 9.30. Schematic of Solvation Wave Drive for Cytopenetration
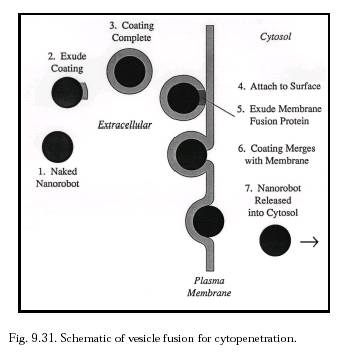
Figure 9.31. Schematic of Vesicle Fusion for Cytopenetration
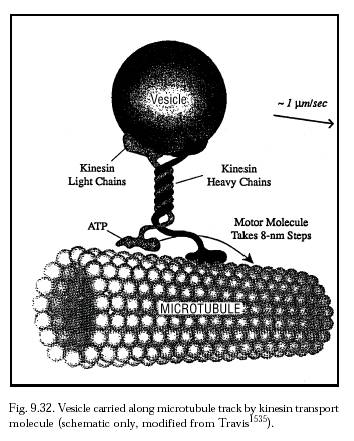
Figure 9.32. Vesicle Carried Along Microtubule Track by Kinesin Transport Molecule
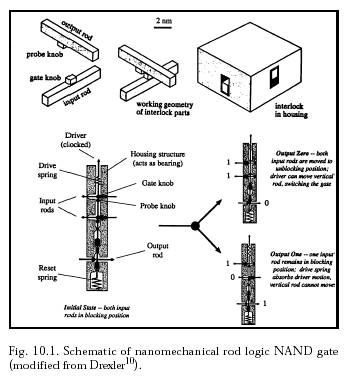
Figure 10.1. Schematic of Nanomechanical NAND Gate
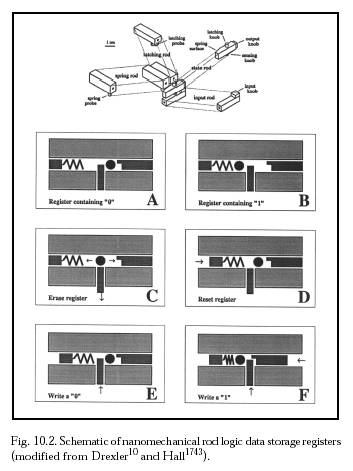
Figure 10.2. Schematic of Nanomechanical Rod Logic Data Storage Registers
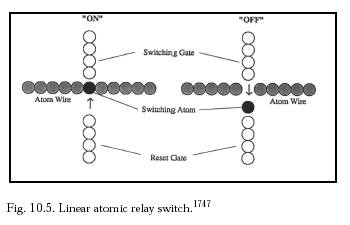
Figure 10.5. Linear Atomic Relay Switch
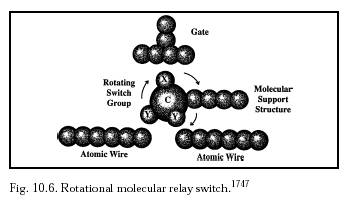
Figure 10.6. Rotational Molecular Relay Switch
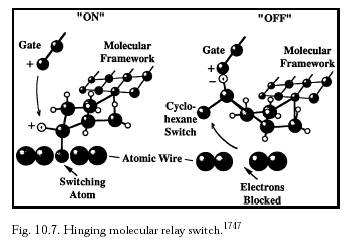
Figure 10.7. Hinging Molecular Relay Switch
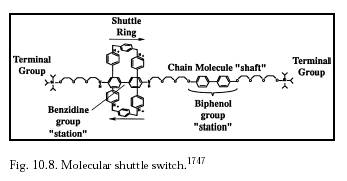
Figure 10.8. Molecular Shuttle Switch
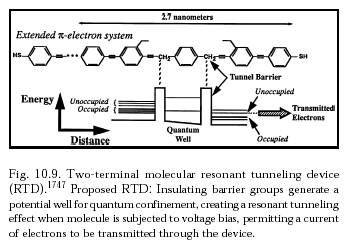
Figure 10.9. Two-Terminal Molecular Resonant Tunneling Device (RTD)
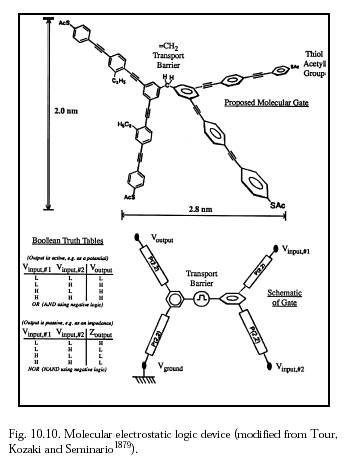
Figure 10.10. Molecular Electrostatic Logic Device
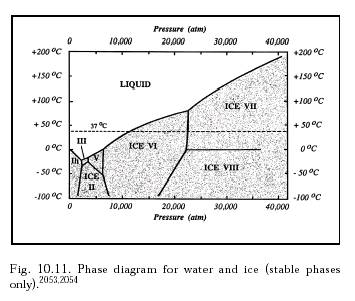
Figure 10.11. Phase Diagram for Water and Ice
Last updated on 14 February 2003