Published in The
Scientific Conquest of Death
Nanomedicine,
Natural Death,
and the Quest for
Accident-Limited Healthspans
© 2004 Robert A. Freitas Jr.
Author, Nanomedicine
Email: rfreitas@rfreitas.com
Address:
6 January 2004
Robert A. Freitas Jr., J.D., published the
first detailed technical design study of
a medical nanorobot ever published in a peer-reviewed mainstream biomedical
journal and is the author of Nanomedicine,
the first book-length technical discussion of the medical applications of
nanotechnology and medical nanorobotics. Volume I was published in
October 1999 by Landes Bioscience while Freitas
was a Research Fellow at the Institute for Molecular Manufacturing in
Abstract.
Each year, medically preventable natural deaths impose terrible costs on
humanity, including the destruction of vast quantities of human knowledge and
human capital. Future medical
technologies, especially nanomedicine, may permit us first to arrest, and later
to reverse, the biological effects of aging and most of the current causes of
natural death, severing
forever the link between calendar time and biological health. Respirocytes
(artificial red cells), microbivores (artificial white cells), and
chromallocytes (enabling whole-body chromosome replacement therapy) provide
examples of the new therapeutic capabilities that medical nanorobotics can
bring in the decades to come, with benefits to include extending the
human healthspan at least tenfold beyond its current maximum length.
Manuscript
Text (including Tables, excluding Figures and References): 6,864 words in length
Nanomedicine,
Natural Death,
and the Quest for
Accident-Limited Healthspans
© 2004 Robert A. Freitas Jr.
Author, Nanomedicine
During the time it takes to read
this sentence out loud, a dozen people just perished worldwide. I think this is an outrage [1] and I want to
tell you why I think so – and what nanomedicine and medical nanorobotics can do
to help.
1. The Worst Natural Disaster in
Human History
Let’s start by looking at the
dimensions of the human holocaust that we call “natural death” (Table 1). The death toll in the Year 2001 was worst in
Table 1. Estimated Worldwide Death Toll in 2001
|
Country |
Deaths in
2001* |
Country |
Deaths in
2001* |
Country |
Deaths in
2001* |
|
|
8,960,922 8,529,844 2,419,113 2,022,033 1,760,240 1,622,562 1,439,159 1,344,938
|
|
1,172,878 1,128,922 1,052,208 863,512 815,100 799,664 732,245 620,339 |
206 other nations
TOTAL DEATHS
|
582,568 541,914 535,435 516,539 509,395 17,026,135
54,995,665 |
* Deaths estimated as midyear population in 2001 for each country [3] multiplied by crude death rate in 2001 for each country [4].
Even the most widely recognized
greatest disasters in human history (Table 2) pale in comparison to the annual
depredations of natural death. For
example, the typhoon that struck
Table 2. Estimated Total Deaths during the Greatest Disasters in Recorded Human History
|
Disastrous Event in Human History* |
Occurred in Years: |
Number of Deathsper
Event (ev) or per Year (yr) |
|
NATURAL DEATH (worldwide) Influenza Pandemic (worldwide) [5b] Great Indian Famine [5b] The Plague (Black Death) [5b] World War II (worldwide) [5a] Flood, Yellow (Hwang-ho) Tai-ping World War I (worldwide) [6b] Korean War (active period, incl. civilians) [7] Democide, Nazi Nishapur Massacre by Mongol Tului [8b] Meru Chahjan Massacre by Mongol Tului [8b] Typhoon in Flood, Yellow (Hwang-ho) Earthquake, Sacking of Rebels destroy Earthquake, French Revolution, Reign of Terror [8d] Earthquake, Democide,
non-Mongol Earthquake,
Rape of Tsunami, Thirty Years’ War [8d] Earthquake, Firebombing
of Tsunami, Friesland, Earthquake, Flood, Earthquake, Erzingan, Nuclear
bombing of Earthquake, Typhoon, Earthquake, Earthquake, Democide,
American Indians [8d] Democide,
African slavery [8d] Volcanic eruption, Typhoon, St. Bartholomew’s Day Massacre [8d] Volcanic eruption, Earthquake,
Earthquake, Earthquake/Tsunami, Earthquake, Volcanic
eruption, Earthquake,
Typhoon,
Democide,
non-Mongol Typhoon,
Typhoon,
Christian
Crusades [8d] Aztec
human sacrifices [8d] Albigensian
Crusade [8d] Democide,
Spanish
Inquisition [8d] Extinction
of the Neanderthals (est.) |
... 2002, 2003, 2004, … Apr-Nov 1918 1710 1347-1351 1940-1945 Feb 1877 - Sep 1878 Aug 1931 1853-1864 1914-1917 1950-1951 1933-1945 ca. 1221 ca. 1223 ca. 1221 12-13 Nov 1970 1949-1987 1887 1917-1987 24 Jan 1556 1258 1936-1945 1975-1979 1945-1948 1928-1949 1642 11 Oct 1737 Jun 1793 - Jul 1794 28 Jul 1976 1919-1923 1909-1918 14th-15th Centuries 16 Dec 1920 Dec 1937 1939 1618-1648 1 Sep 1923 13-15 Feb 1945 1923-1949 30 Apr 1991 1861-1865 1228 12 Sep 1290 1911 27 Dec 1939 6 Aug 1945 28 Dec 1908 1900-1920 5 Oct 1864 1900-1917 1958-1987 31 May 1935 31 May 1970 21 Jun 1990 May-Jun 1965 16th-19th Centuries 1948-1987 1451-1870 8 May 1902 16 Oct 1942 1945-1987 24 Aug 1572 27 Aug 1883 27 Dec 2003 1965-1987 24 Jan 1939 15 Aug 1950 13 Jan 1915 1917-1949 15 Jun 1896 16 Sep 1978 19-20 Sep 1985 14-16 Nov 1985 7 Dec 1988 1944-1987 4 Feb 1976 28-29 May 1963 24 Aug 79 AD 1 Nov 1755 19 Nov 1977 221 BC - 19th Century 1926-1982 18 Sep 1906 15 Dec 1965 1900-1987 13th-19th Centuries 1095-1272 1300-1500 1570-19th Century 1208-1249 12th-19th Centuries 16th-18th Centuries 5th-19th Centuries 10th-19th Centuries 33,000-30,000 BC ? |
~52,000,000/yr 21,640,000/ev 20,000,000/ev 15,000,000/yr 9,130,000/yr 5,700,000/yr 3,700,000/ev 2,500,000/yr 2,130,000/yr 1,900,000/yr 1,750,000/yr 1,747,000/ev 1,600,000/ev 1,300,000/ev 1,000,000/ev 927,000/ev 900,000/ev 884,000/yr 830,000/ev 800,000/ev 663,000/yr 531,000/yr 528,000/yr 486,000/yr 300,000/ev 300,000/ev 263,000/ev 242,000/ev 215,000/yr 209,000/yr 200,000/yr 200,000/ev 200,000/ev 200,000/ev 191,700/yr 143,000/ev 135,000/ev 133,000/yr 131,000/ev 106,000/yr 100,000/ev 100,000/ev 100,000/ev 100,000/ev 91,223/ev 85,000/ev 70,900/yr 70,000/ev 62,700/yr 51,800/yr 50,000/ev 50,000/ev 50,000/ev 47,000/ev 45,900/yr 42,600/yr 41,200/yr 40,000/ev 40,000/ev 40,000/yr 36,000/ev 36,000/ev 35,000/ev 33,100/yr 30,000/ev 30,000/ev 29,980/ev 28,400/yr 27,000/ev 25,000/ev 25,000/ev 25,000/ev 25,000/ev ~25,000/ev 24,900/yr 23,000/ev 22,000.ev 20,000/ev 20,000/ev 16,800/yr 13,200/yr 10,000/ev 10,000/ev 9,400/yr 7,500/yr 5,700/yr 5,000/yr 5,000/yr 4,900/yr 2,900/yr 1,800/yr 1,400/yr 1,100/yr ~1,000/yr |
|
* Democide = the murder of any person or civilian population by (usually nondemocratic) governments, including acts of genocide, politicide, and mass murder, but excluding war deaths [8]. |
||
2. The High Cost to Humanity of
Natural Death
Of course we’re outraged by natural
death because of the obvious personal consequences. But the cost to humanity of our individual
deaths is rarely appreciated, truly staggering, and equally heartbreaking.
Each one of us carries within us a
complex universe of knowledge, life experience, and human relationships. Each individual is gifted with unique insights
possessed by no one else. Almost all of
this rich treasury of information is forever lost to mankind when any one of us
dies.
This lost treasury is truly
enormous. If the vast content of each
person’s life can be summarized in just one book, then natural death robs us of
52 million books every year,
worldwide. But the U.S. Library of
Congress, the world’s largest collection of physical books, holds only 19
million volumes [10]. So each year, we
allow a destruction of knowledge equivalent to three Libraries of
Congress. It is as if in 2003, somebody
burned the Library of Congress to the ground.
Once in January, then again in May, and again in September. 52 million books go up in flames. And then in 2004, they burn it down again,
three more times. And then again in
2005. What’s even worse is that if you
agree with me that the sum total of each human mind would really fill many,
many books, and not just one, then you must accept that the devastation of
knowledge is actually far greater than I’ve suggested here.
Besides this staggering sacrifice
of information, natural death also destroys wealth on a grand scale. According to the Lasker Foundation [11], a
dozen or so studies since the mid-1970s have found the value for human life is
in the range of $3 to $7 million constant dollars, using many different
methodologies.
More recently, Murphy and Topel
[12] at the University of Chicago drew the chart in Figure 1, which I’ve
updated to Year 2000 dollars, showing the value of human life at every age for
white males. It recognizes that fewer
years remain to us at older ages. But
this is only half of the equation. The
chart in Figure 2 shows my estimate of the number of people that died in the
Figure 1. U.S. Value of Human Life, by Age, for White
Males in the Year 2000 (modified from Murphy and Topel [12])
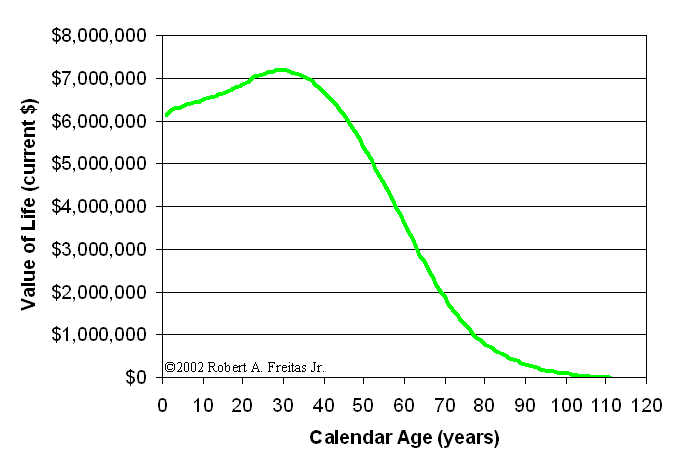
Figure 2. Number of Human Deaths in
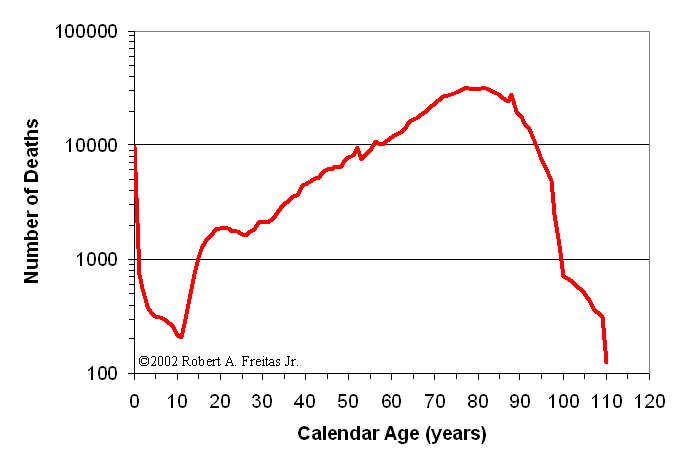
If you multiply the death rate at
each age, from the chart in Figure 2, by the dollar value at each age, from the
previous chart in Figure 1, you get the economic loss at each calendar age, due
to natural death. The sum of these
economic losses divided by the total number of deaths gives you the average
economic value of a human life lost, across all the ages of a natural
lifespan. The result is an average value
of about $2 million dollars for each (white male) human life lost, with similar
conclusions for either gender and for other races. If we conservatively assume that the
population age structure and the age-specific mortality is the same worldwide
as in the
How big of an economic calamity is
this? Taking Federal Reserve figures for
the total tangible wealth of the United States, including all financial assets,
all real estate, and all consumer durables, net of debt [16], and applying the
ratio of U.S. GDP [17] to world GDP [18] gives us a crude estimate of total
global tangible net worth of $91.35 trillion dollars for the year 2000. So this means that every year, natural death
robs us of human capital roughly equivalent in value to the entire tangible
wealth of the world.
It is as if in the Year 2003,
someone took out a giant broom and swept up all the physical assets of human
civilization into a cosmic trash can, and threw it all away. That’s $104 trillion dollars of financial
assets, real estate, and durable goods – gone forever. And then in 2004, the giant broom sweeps
again – another $104 trillion dollars of human capital is destroyed, or three
times larger than the $34 trillion dollars of annual economic activity
represented by world GDP [18]. Then it
happens again in 2005.
But the economic disaster caused by
natural death is even worse, if you go back further in history. Since the modern human species first emerged,
perhaps 25 millennia ago, 34 billion people have ever walked the Earth [19],
and 28 billion of us have already died.
The equivalent total information waste is more than 28 billion books,
enough to fill almost 2000 Libraries of Congress. The equivalent total economic waste is about
$60 thousand trillion dollars, enough to rebuild our current tangible civilization
600 times over. If you carry the tally
back a million years, to the very dawn of man, all these figures about double
[19].
There can only be one logical
conclusion: Natural death is an incredibly costly disaster of unprecedented
proportions in human history.
So ... what is being done about
this ongoing catastrophe? Let’s take a
very broad, statistical look at the progress to date.
3. Current Progress in Eliminating
the Disaster of Natural Death
The chart shown in Figure 3,
compiled from Census Bureau data [20], shows that for the last one-and-a-half
centuries, life expectancy at birth has risen dramatically in the
Figure 3. Expected Age at Death (EAD) in the
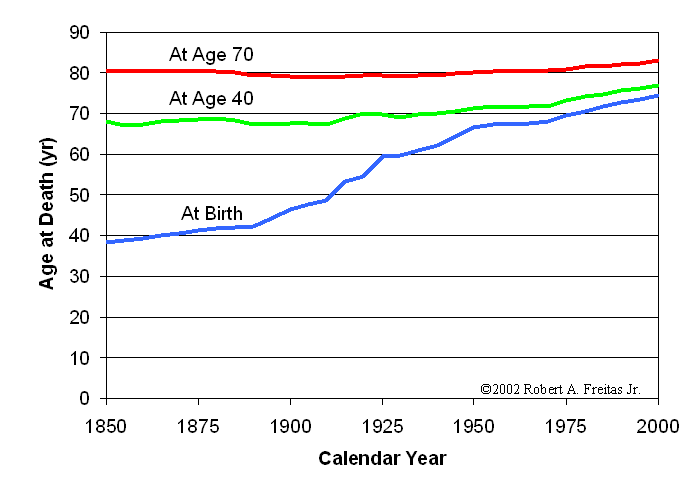
But 20th century medical technology
has mainly improved the longevity of the very young. Since 1850, the Expected Age at Death of a
40-year-old has only improved from 68 years to 77 years. The Expected Age at Death of a 70-year-old
has only improved from 80 years to 83 years.
In other words, a 70-year-old’s chances of living another 10 years were
about as good in 1850 as they are today.
That’s not much progress. But
let’s take a closer look at the data.
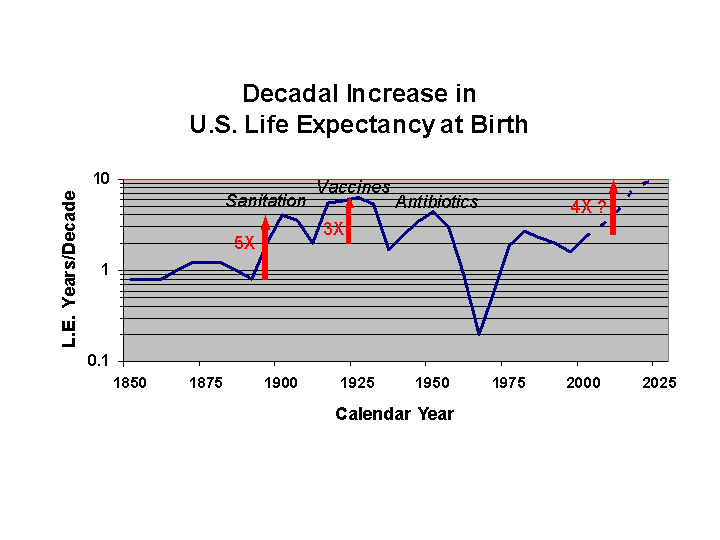
The chart in Figure 4 shows the
rate of Change in Life Expectancy at birth since 1850, as measured in years of
extra life expectancy achieved by medical technology per decade of calendar
time [20]. (In all cases from 1850-2000,
the rate of change is a positive increase when measured over 10-year
spans.) If we could get to a rate of 10
years of lifespan extension per decade, then medical technology would be
extending life exactly as fast as we’re aging, postponing natural death, on
average, indefinitely. We see from
Figure 4 that the Change in Life Expectancy improved at only 1 year per decade
up until 1890. After 1890, the Change in
Life Expectancy of newborns jumped dramatically, reaching more than 6 years per
decade at its peak in 1925. This was due
to the rapid introduction of several basic medical breakthroughs, like public
sanitation [21], comprehensive vaccination programs [22], and later,
antibiotics [23].
Figure
4. Decadal Increase in
Worried parents and life insurance
salesmen often complain that the young think they’re immortal. Well, in a sense, the young are almost
right! There are age groups for which it can validly be said that extreme life
extension has already been achieved, using existing medical technology. To better appreciate this accomplishment, we
need to spend one paragraph briefly discussing death rates.
The chart in Figure 5 shows the
aggregate death rate for all males, at all ages, in the United States, from
1850 to 2000 [24]. In 1850, each male
had a 2 percent chance of dying in the next year. By 2000, each male had a 1 percent chance of
dying in the next year. So over this
150-year time span, the death rate was cut in half. As a result, the life expectancy from birth
[25] has approximately doubled, from 38 years in 1850 to almost 75 years in
2000, as shown by the black curve in Figure 6.
A very simple formula, written in red below, can be devised for
estimating the Expected Age at Death.
This formula captures the simple truth that, roughly speaking, cutting
the death rate in half doubles the life expectancy, as measured from the
current age of the individual. The
formula assumes a single net death rate, for a whole population of mixed
ages. This is an important point,
because the natural death rate in humans usually depends on our physiological
age. Death rates typically rise,
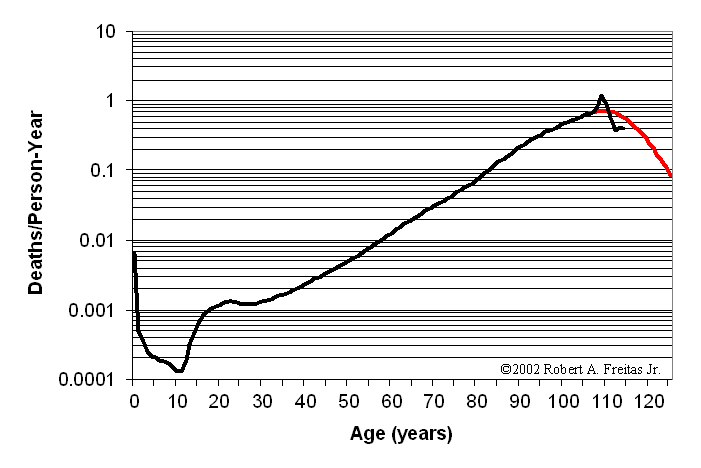
log-linearly, with advancing age, except at the oldest ages. (The documented deceleration of mortality in
humans above age 109 (Figure 7), reported by Vaupel et al [16], and in medflies
above age 60 days, reported by Carey et al [26], is one of the most intriguing
recent findings in longevity research).
Figure 5.
Death Rate (DR) for U.S.
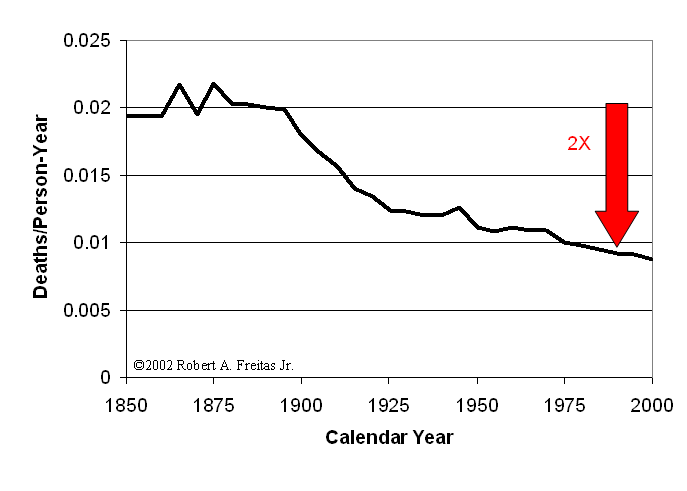
Figure 6.
Estimated vs. Actual Expected Age at Death for U.S.
Figure 7. Death Rate Deceleration in Older Humans -- Vaupel’s Data [16] (black curve, ages 80-114), Census Bureau Data [24] (black curve, ages 0-79), and One Possible Extrapolation of the Trend (smooth red curve, ages 108-125)
Now let’s return to my claim that
there are age groups that have already achieved extreme life extension, using
existing medical technology. Medical
technology has had its greatest impact to date in preventing infant mortality,
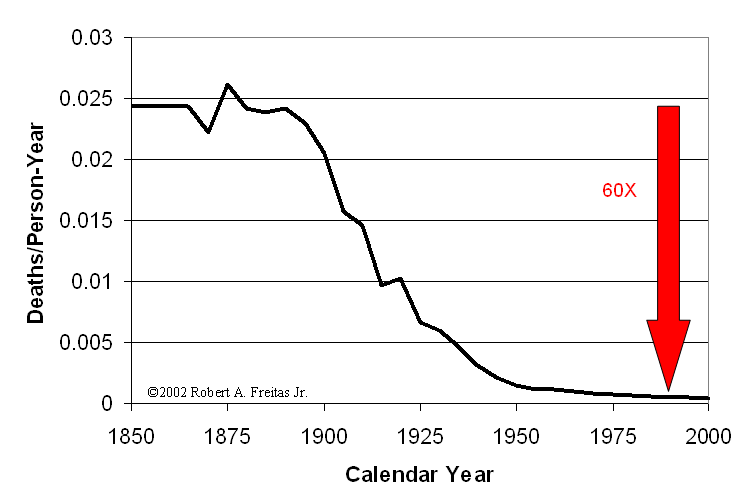
especially between the ages of 1 to 4.
Our dramatic success in reducing the death rate in this youthful age
cohort [27] is illustrated in Figure 8.
For the Year 1850, a young child in this age cohort had a 2.4% probability
of dying in the next year. Today, the
probability of dying in the next year for these children has been slashed from
2.4% to 0.04%. That’s a phenomenal
60-fold reduction.
Figure 8.
Death Rate (DR) in U.S.
What if future medical technologies
permit us first to arrest, and later to reverse, the biological effects of
aging? In such an era, our bodies would
no longer tumble down a staircase of degeneration and frailty. Instead, our statistical death rate would
take on some approximately fixed value that’s appropriate for our
physiological-age cohort, not our calendar-age cohort. Biological age would no longer march in
lockstep with calendar age.
So, how much longer might we live,
if we could just keep the bodies we had when we were young? Figure 9 shows that in the Year 1850, the
death rate for a U.S. male between the ages of 1 and 4 implied an Expected Age
at Death, according to our formula (see Figure 6), of only 31 years. That is, in 1850, a child that could remain
perpetually 1-4 years old physiologically, would have died, on average, after
31 calendar years. Early childhood was
still very unhealthy and dangerous in those days.
Figure 9.
Expected Age at Death, Assuming Age-Invariant Death Rate, for U.S.
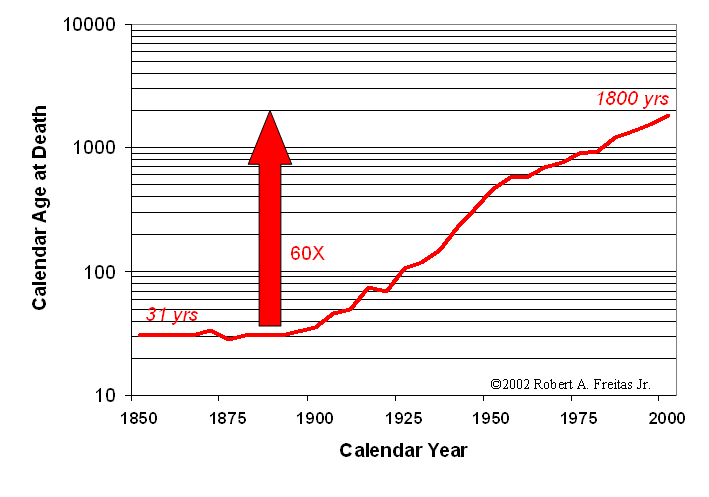
But as medical technology slowly
improved, childhood became vastly less dangerous. Most of the specific medical causes of early
childhood death have now been analyzed and conquered. As a result, a child that could remain
perpetually 1-4 years old biologically today would not die, on average, until
he or she reached the calendar age of 1800 years. Death would usually come from some form of
non-medical accident, which is the leading cause of death up to age 44 [28].
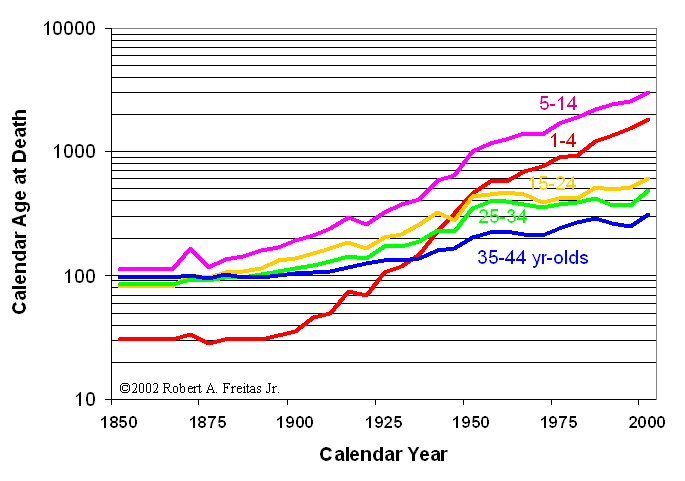
Of course, most of us aren’t 1-4
years old. How long would we live if we
could halt any further biological aging of our bodies right now, at our current age?
The answer for various biological age cohorts, up to 44 years old [27],
is shown in Figure 10. The 10-year-olds
among us would fare the best, reaching an average Expected Age at Death
exceeding 3000 calendar years. The
20-year-olds would make it to 600 calendar years. Life has even become less dangerous for the
40-year-olds, who could survive to an average calendar age of 300 years in
today’s medical environment, if further biological aging could be immediately
halted. These are remarkable achievements
of medical technology compared to the Year 1850, a time when none of these
groups would have survived more than 80-100 calendar years. Note that all of these curves – and most
especially the youngest cohorts – began their steep climbs into extended
longevity during the latter half of the 19th century.
Figure
10. Expected Age at Death, Assuming
Age-Invariant Death Rate, for U.S.
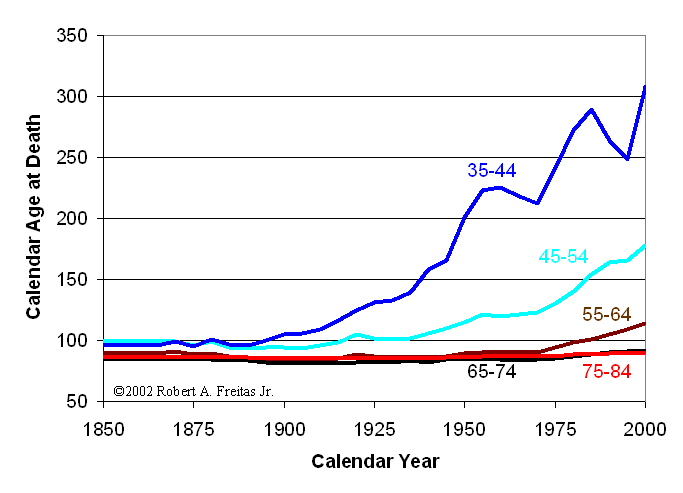
If you’re over 45 [27], the picture
is not yet so bright (Figure 11).
Non-aging biological 50-year-olds would live to a calendar age of 178
years. Non-aging 60-year-olds could only
expect to survive to 113 calendar years in the current medical
environment. But the news is not all bad
for the elders. The death rate for
80-year-old
Figure 11.
Expected Age at Death, Assuming Age-Invariant Death Rate, for U.S.
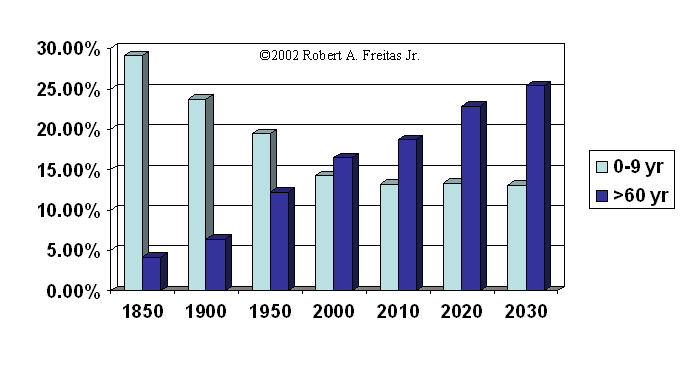
Now, you remember those Expected
Age at Death curves for the youngsters that began their steep climb into
extended longevity in the late 19th Century?
The biggest gains were in the 1-10 year old cohorts, where death rates
fell 30- to 60-fold. These gains began
at a time when this age cohort made up 20% to 30% of the
I think history is about to repeat,
this time at the opposite end of the age scale.
In the
Figure 12.
Age Distribution of U.S.
4. Molecular Nanotechnology and
Nanomedicine
The greatest advances in halting
biological aging and preventing natural death are likely to come from the
fields of biotechnology and nanotechnology – that is, from nanomedicine. Nanomedicine is most simply and generally
defined as the preservation and improvement of human health, using molecular
tools and molecular knowledge of the human body [30].
In the near term, say, the next 5
years, the molecular tools of nanomedicine will include biologically active
materials with well-defined nanoscale structures, such as dendrimer-based
organic devices and pharmaceuticals based on fullerenes and organic
nanotubes. We should also see genetic
therapies and tissue engineering becoming more common in medical practice,
which can contribute a little to life extension at the oldest ages.
In the mid-term, the next 5 or 10
years or so, knowledge gained from genomics and proteomics will make
possible: (1) new treatments tailored to
specific individuals, (2) new drugs targeting pathogens whose genomes have now
been decoded, (3) stem cell treatments to repair damaged tissue, replace
missing function, or slow aging, and (4) biological robots made from bacteria
and other motile cells that have had their genomes re-engineered and
re-programmed. We could also see
artificial organic devices that incorporate biological motors or self-assembled
DNA-based structures for a variety of useful medical purposes. We may even begin to see targeted anti-aging
treatments which address each of the seven specific forms of cellular damage
that produce pathologies leading to natural death, as described by Aubrey de
Grey and colleagues [31], although there remain many institutional obstacles to
direct progress via this conventional approach [32].
In the farther term, perhaps
somewhere in the 10 or 20 year time frame, the first fruits of molecular
nanorobotics should begin to appear in the medical field. My own theoretical work in nanomedicine has
concentrated on medical nanorobotics using diamondoid materials and
nanoparts. This area, though clinically
the most distant and still mostly theoretical, holds the greatest promise for
health and life extension. With medical
nanorobotics, we will gain the technological ability to perform specific
internal repairs on individual cells in real time, thus largely eliminating all
major causes of natural biological death.
The early theoretical work done by
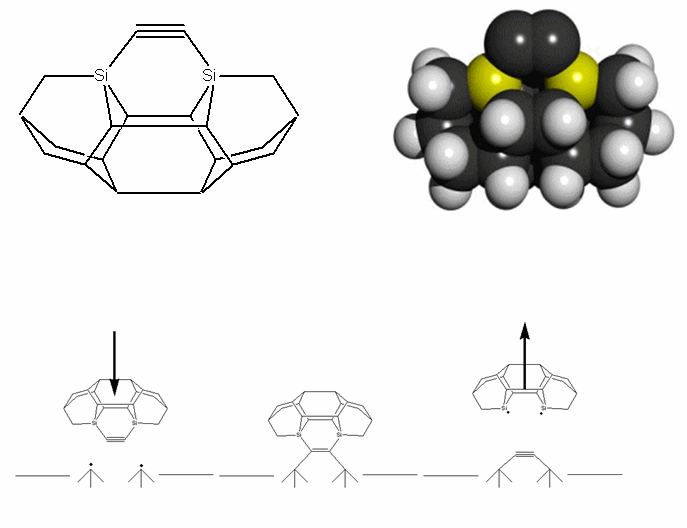
Drexler and Merkle, including most prominently a collection of bearings, gears,
and other possible nanorobot parts, is well-known [33]. Their most complex design was a nanoscale
neon pump (Figure 13) having over 6,000 atoms, which was later simulated by
computational chemists at California Institute of Technology [34]. The device could serve either as a pump for
neon gas atoms or (if run backwards) as a motor to convert neon gas pressure
into rotary power. The CalTech
researchers reported that preliminary molecular dynamics simulations of the
device showed that it could indeed function as a pump, although “structural
deformations of the rotor can cause instabilities at low and high rotational
frequencies.” The motor was not particularly
energy efficient – but it worked.
Figure 13. Side views of a 6165-atom neon gas pump/motor [35]. © Institute for Molecular Manufacturing (www.imm.org).
The ultimate goal of molecular
nanotechnology is to develop a manufacturing technology able to inexpensively
manufacture most arrangements of atoms that can be specified in molecular
detail. Building medical nanorobots,
each made of millions or billions of atoms, in batches of trillions of devices
cheaply enough to be practical for medical therapies requires some new kind of manufacturing
technology. Molecular manufacturing will
be the ultimate manufacturing technology in terms of its precision,
flexibility, and low cost. Two central
mechanisms have been proposed to achieve these goals at the molecular
scale: (1) programmable positional
assembly including, for example, fabrication of diamond structures using
molecular feedstock, and (2) massive parallelism of all fabrication and
assembly processes.
As machine structures become more
complex, getting all the parts to spontaneously self-assemble in the right
sequence is increasingly difficult. To
build complex structures, it makes more sense to design a mechanism that can
assemble a molecular structure by what is called positional assembly – that is,
picking and placing molecular parts. A
device capable of positional assembly at the molecular scale would work much
like the robot arms that manufacture cars on automobile assembly lines in
In order to build durable
nanorobots, we first must be able to fabricate parts made of diamond, sapphire,
or similar strong materials. The
controlled addition of carbon atoms to a growth surface of the diamond crystal
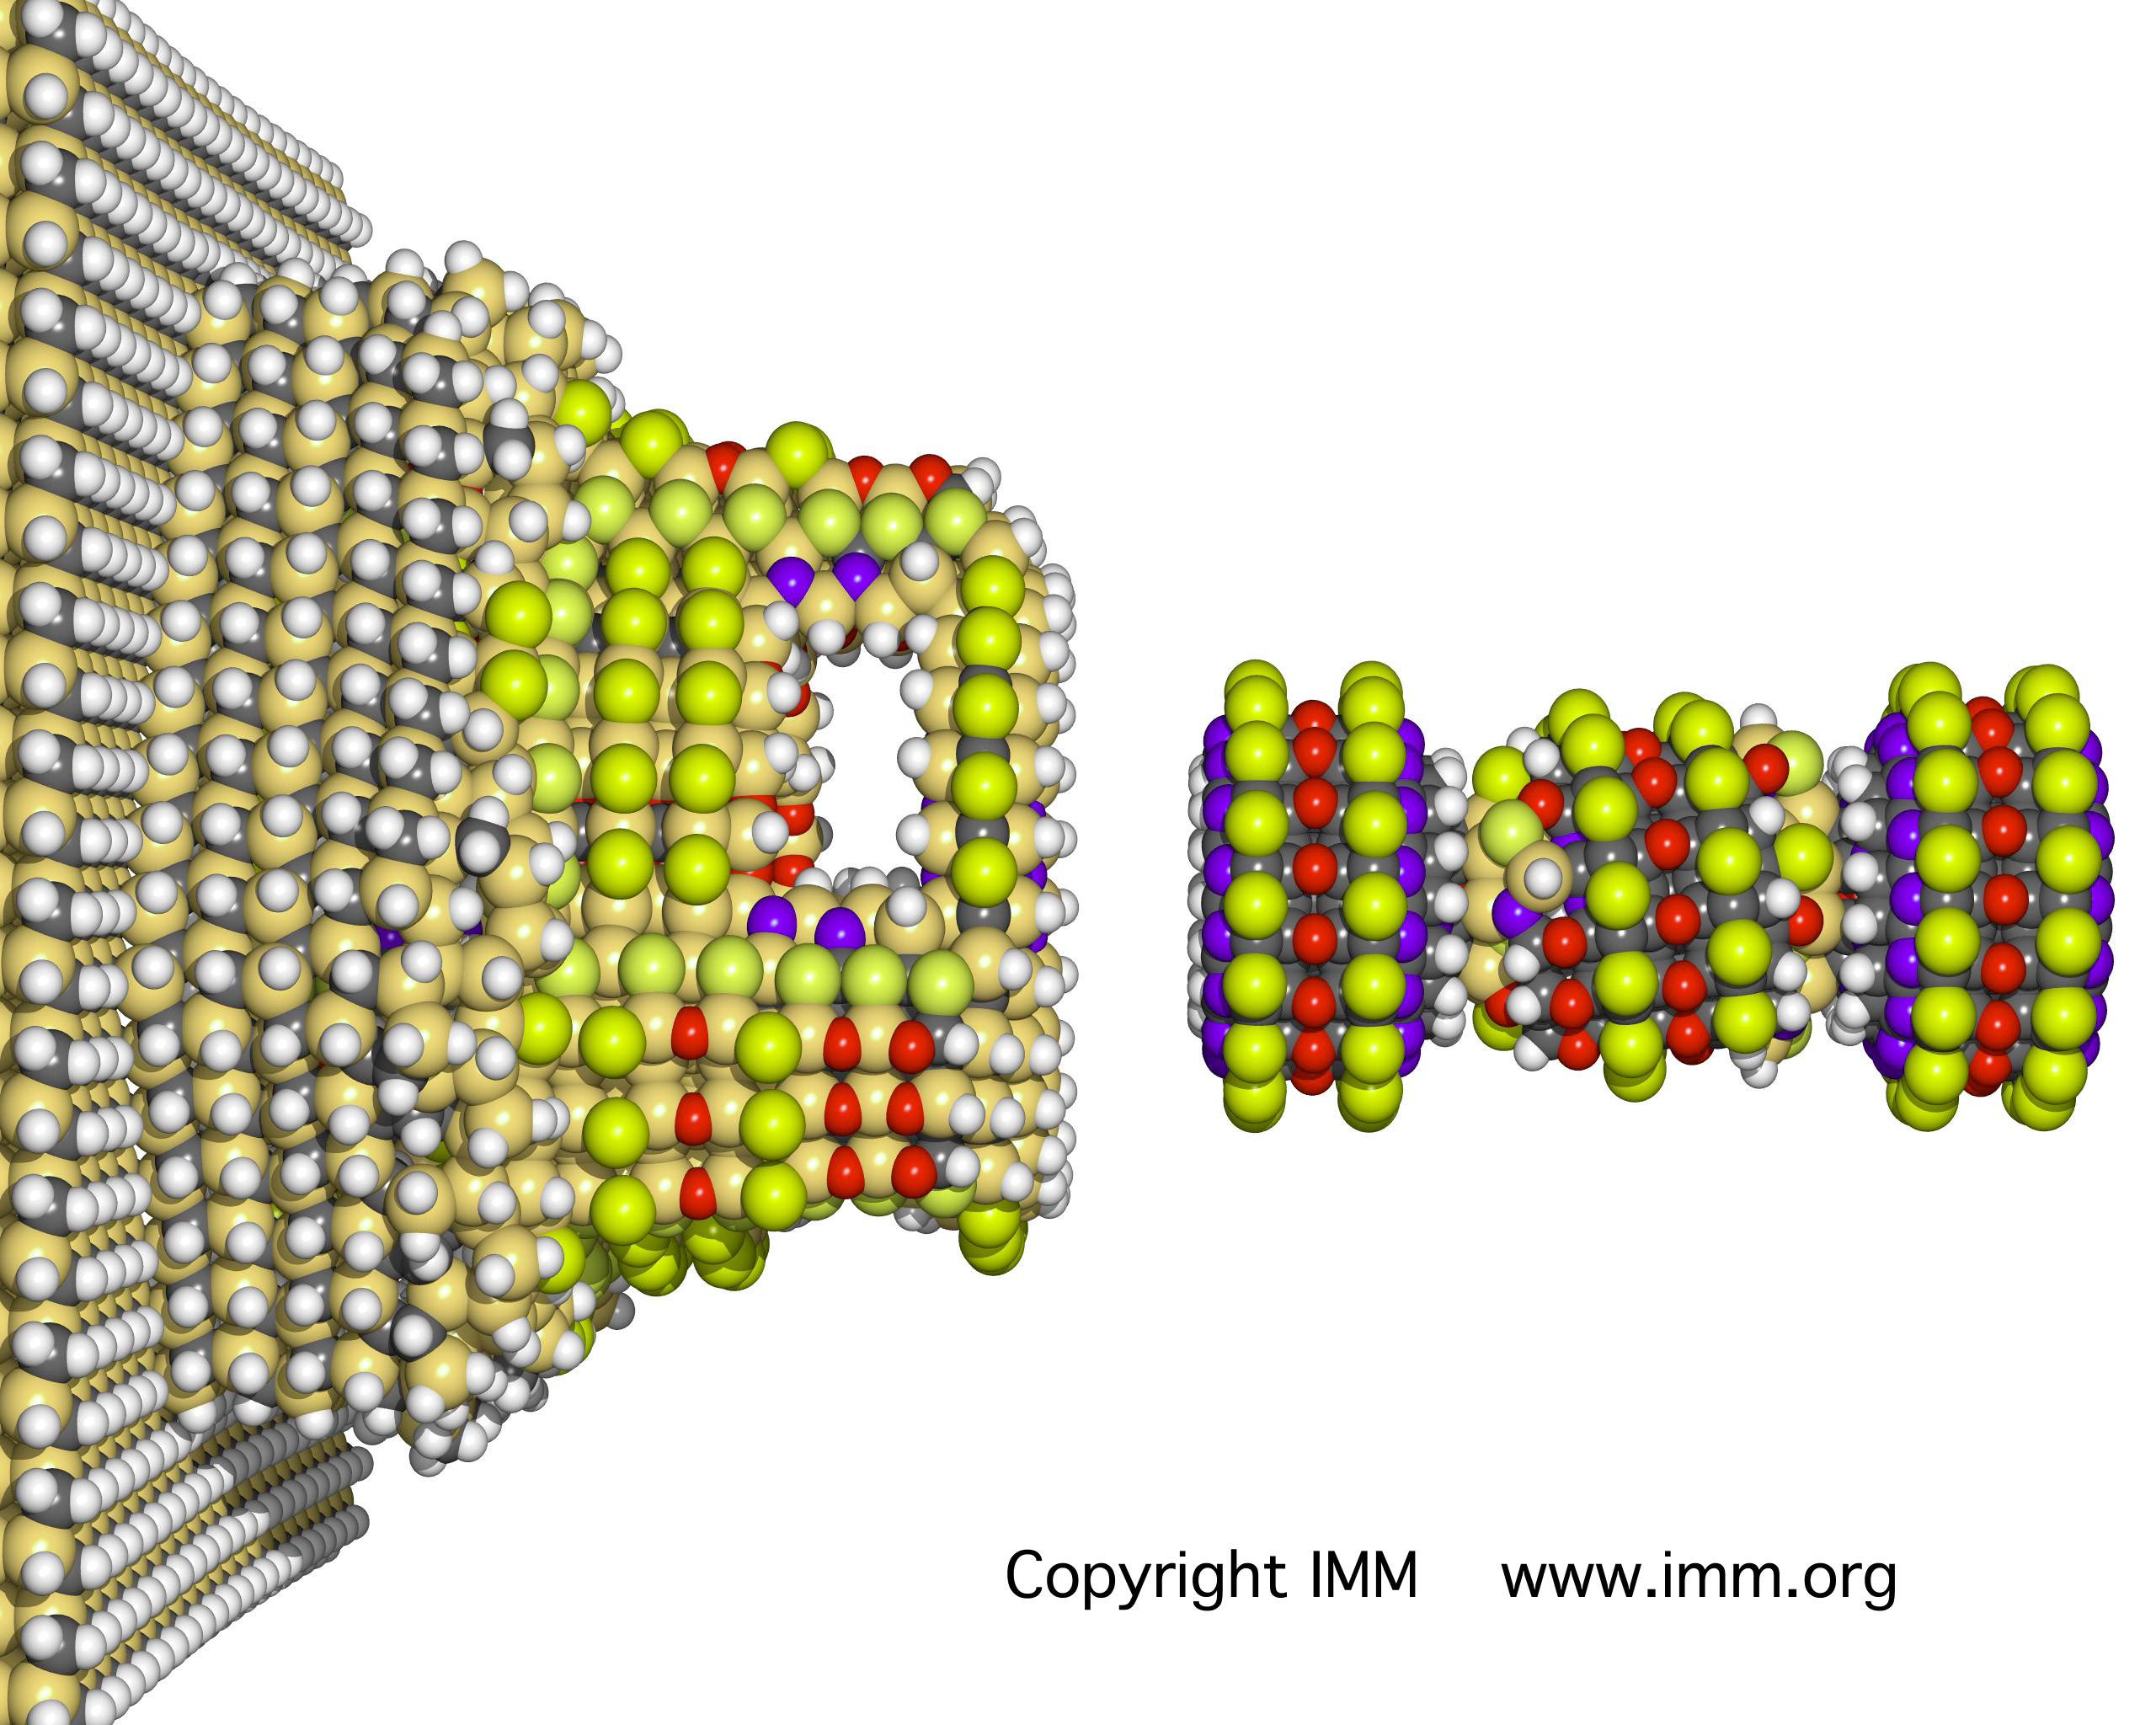
lattice is called diamond mechanosynthesis [36, 37]. In 2003, Merkle and Freitas [36] proposed a
new family of mechanosynthetic tools intended to be employed for the placement
of two carbon atoms – a CC “dimer” – onto a growing diamond surface at a
specific site (Figure 14). These tools
should be stable in vacuum and should be able to hold and position a CC dimer
in a manner suitable for positionally controlled diamond mechanosynthesis at
liquid nitrogen temperatures and possibly even at room temperatures. The function of a dimer placement tool is to
position the dimer, then bond the dimer to a precisely chosen location on a
growing diamond molecular structure, and finally to withdraw the tool – leaving
the dimer behind on the growing structure.
The diamond structure is then is built up, dimer by dimer, until a
complete molecularly precise nanopart has been fabricated.
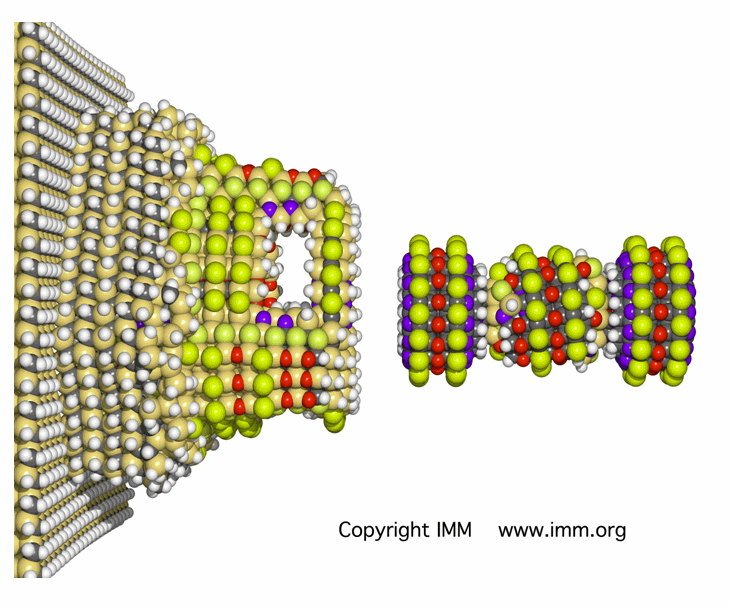
Figure 14. Merkle-Freitas mechanosynthesis dimer placement tooltip molecule (above) used in a dimer placement sequence (below) on a diamond surface prepared with radicals [38]
Both the fabrication of nanoparts
and the assembly of nanoparts into working nanorobots must be automated and
must employ massive parallelism to be practical. There must be many hands at work
simultaneously. Without this
parallelism, there would be too many atoms per device (millions/billions) and
too many devices needing to be assembled per application (trillions). New techniques for massively parallel
positional assembly are being developed, including massively parallel
manipulator arrays and self-replicating systems. One example of parallel assembly arrays,
called “exponential assembly,” has been proposed and patented by Zyvex
[39]. There have also been many
proposals for self-replicating systems known as molecular assemblers, tiny
machines that could manufacture nanorobots with molecular precision [40].
What sorts of medical nanorobots
could we build, and what would they do, if we could build them? The first simple device that I designed 9
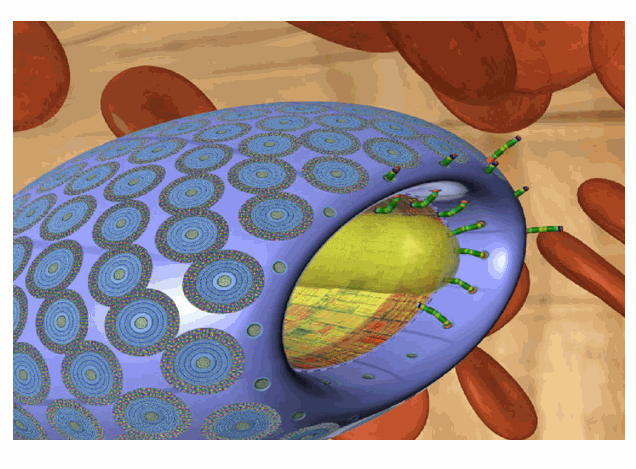
years ago was the respirocyte, an artificial red blood cell (Figure 15). I show them blue in color, because part of
the outermost shell is made of sapphire, a tough ceramic made of aluminum and
oxygen atoms which is almost as hard as diamond. Natural red cells carry oxygen and carbon
dioxide throughout the human body. We
have about 30 trillion of these cells in all our blood. Half our blood volume is red cells. Each red cell is about 3 microns thick and 8
microns in diameter. Respirocytes are
much smaller than red cells – only 1 micron in diameter, about the size of a bacterium. Respirocytes are microscopic pressure tanks
with a hull made mostly of flawless diamondoid crystal. These tanks could be safely charged up to
100,000 atmospheres of pressure, but we’re conservative and only run them up to
1000 atmospheres.
Figure 15. An artificial red cell
– the respirocyte [41]. Designer Robert
A. Freitas Jr. ©1999 Forrest
Bishop. Used with permission.
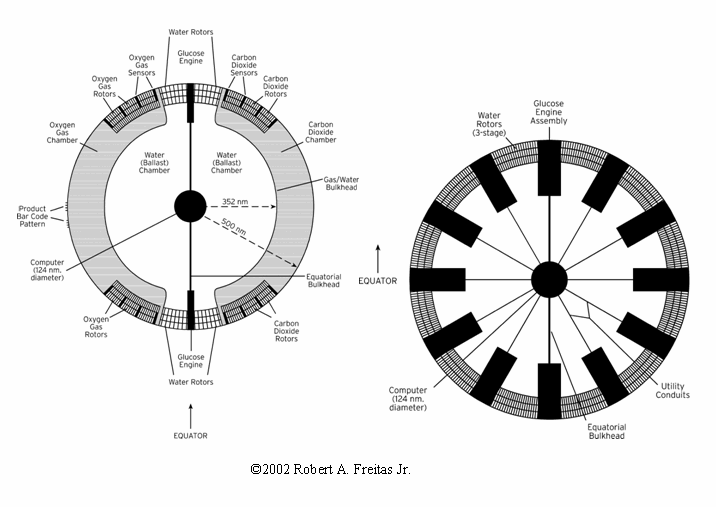
Respirocytes are self-contained
nanorobots built of 18 billion precisely arranged structural atoms. Each device has an onboard computer and an
onboard powerplant. Most importantly,
molecular pumps are arranged on the surface to load and unload gases from the
pressurized tanks. Tens of thousands of
individual pumps, called molecular sorting rotors, cover a large fraction of
the hull surface of the respirocyte (Figure 16). As the rotor turns, molecules of oxygen (O2)
or carbon dioxide (CO2) may drift into their respective binding
sites on the rotor surface and be carried into (or out of) the respirocyte
interior. There are 12 identical pumping
stations laid out around the equator of the respirocyte, with oxygen rotors on
the left, carbon dioxide rotors on the right, and water rotors in the
middle. Temperature and concentration
sensors tell the devices when to release or pickup gases. Each station has special pressure sensors to
receive ultrasonic acoustic messages, so doctors can tell the devices to turn
on or off, or change their operating parameters, while the nanorobots are
inside a patient. The shaded area at
left is the O2 storage tank, the area at right is the CO2
tank, the black dot at the center is the computer, and the open volume around
the computer can be a vacuum, or can be filled or emptied with water. This allows the device to control its
buoyancy very precisely and provides a crude but simple method for removing
respirocytes from the blood using a centrifuge.
Figure 16. Internal cutaway view of respirocyte – equatorial (left) and polar (right) view [41]. ©1996 Robert A. Freitas Jr.
We can’t build respirocytes today,
but when we can build them, they could be used as an emergency treatment at the
scene of a fire, where the victim has been overcome by carbon monoxide
poisoning. In an animation [42] from the
PBS documentary “Beyond Human”, 5 cubic centimeters of respirocyte-containing
fluid are injected into the patient’s vein.
After passing through the pulmonary bed, the heart, and some major
arteries, the respirocytes make their way into smaller, and smaller, blood
vessels. After about 30 seconds, they
reach the patient’s capillaries and begin releasing life-giving oxygen to
starving tissues. In the tissues, oxygen
is pumped out of the device by the sorting rotors on one side. Carbon dioxide is pumped into the device by
the sorting rotors on the other side, one molecule at a time. Half a minute later, when the respirocyte
reaches the patient’s lungs, these same rotors reverse their direction of
rotation, recharging the device with fresh oxygen and dumping the stored CO2,
which can then be exhaled by the patient.
Only 5 cc’s of respirocytes, just
1/1000th of our total blood volume, could duplicate the oxygen-carrying
capability of the entire human blood mass.
Each respirocyte transports hundreds of times more physiologically
available oxygen molecules than an equal volume of natural red blood
cells. A half a liter of respirocytes,
the most that could possibly be safely added to our blood, would allow a person
to hold his breath at the bottom of a swimming pool for up to 4 hours, or to
sprint at top Olympic speed for up to 12 minutes, without taking a breath.
Another medical nanorobot I
designed more recently is the microbivore (Figure 17) – an artificial white
cell [43]. One main task of natural
white cells is to absorb and digest microbial invaders in the bloodstream. This is called phagocytosis. Microbivore nanorobots would also perform
phagocytosis, but would operate much faster, more reliably, and under human
control. Like the respirocyte, the
microbivore is much smaller than a red blood cell but is more complex than the
respirocyte, having about 30 times more atoms involved in its construction.
Figure 17. An artificial white cell – the microbivore
[43]. Designer Robert A. Freitas Jr.,
illustrator Forrest Bishop. ©2001 Zyvex
Corp.
The microbivore device is a
flattened sphere with the ends cut off.
It measures over 3 microns in diameter along its major axis and 2
microns in diameter along its minor axis.
This size helps to ensure that the nanorobot can safely pass through
even the narrowest of human capillaries and other tight spots in the spleen
(e.g., the interendothelial splenofenestral slits [44]) and elsewhere in the
human body. The microbivore has a mouth
with an irising door, called the ingestion port, where microbes are fed in to
be digested. The microbivore also has a
rear end, or exhaust port. This is where
the completely digested remains of the pathogen are expelled from the
device. The rear door opens between the
main body of the microbivore and a tail-cone structure. Inside the microbivore, there are two
concentric cylinders. The bacterium is
minced into little pieces in the morcellation chamber, the smaller inner
cylinder, and then the remains are pushed into the digestion chamber, the
larger outer cylinder. In a
preprogrammed sequence engineered digestive enzymes are added, then removed,
using an array of sorting rotors. In
just 30 seconds these enzymes reduce the microbe’s remains to simple chemicals
– like amino acids, free fatty acids, and simple sugars – which are then
expelled harmlessly from the device. A
human neutrophil, the most common type of leukocyte or white cell, can also
capture and engulf a microbe in a minute or less, but complete digestion and
excretion of the bug’s remains can take an hour or longer.
But the first thing a microbivore
has to do is reliably acquire a pathogen to be digested. If the correct bacterium bumps into the
nanorobot surface, reversible binding sites on the microbivore hull can
recognize and weakly bind to the bacterium.
A set of 9 different antigenic markers should be specific enough, since
all 9 must register a positive binding event to confirm that a targeted microbe
has been caught. There are 20,000 copies
of these 9-marker receptor sets, distributed in 275 disk-shaped regions across
the microbivore surface. These receptors
are the multicolored dots you see around the perimeter of each disk. Inside the receptor ring are more rotors to
absorb glucose and oxygen from the bloodstream for nanorobot power. At the center of each receptor disk is a
grapple silo (see below); each disk is
150 nanometers in diameter.
Once a bacterium has been captured
by the reversible receptors, telescoping grapples rise up out of the
microbivore surface and attach to the trapped bacterium. The microbivore grapples are modeled after a
watertight manipulator arm originally designed by Drexler [45] for nanoscale
manufacturing. This arm is about 100
nanometers long and has various rotating and telescoping joints that allow it
to change its position, angle, and length.
But the microbivore grapples need a greater reach and range of motion,
so they’re longer and more complex, with many additional joints. After rising out of its silo, a grapple arm
can execute complex twisting motions, and adjacent grapple arms can physically
reach each other, allowing them to hand off bound objects as small as a virus
particle. Grapple handoff motions can
transport a large rod-shaped bacterium from its original capture site forward
into the mouth of the microbivore device.
The bug is rotated into the proper orientation as it approaches the open
mouth, as depicted in Figure 17.
Our natural
white cells – even when aided by antibiotics – can sometimes take weeks or
months to completely clear bacteria from the bloodstream. By comparison, a single terabot dose of
microbivores should be able to fully eliminate bloodborne pathogens in just
minutes or hours, even in the case of locally dense infections. Microbivores would be up to ~1000 times
faster-acting than natural leukocytes.
They’d digest almost 100 times more microbial material than an equal
volume of natural white cells could digest, in any given time period.
Even more
powerful applications – most importantly, involving cellular replacement or
repair – are possible with medical nanorobotics. For example, most diseases involve a
molecular malfunction at the cellular level, and cell function is significantly
controlled by gene expression of proteins.
As a result, many disease processes are driven either by defective
chromosomes or by defective gene expression.
So in many cases it may be most efficient to extract the existing
chromosomes from a diseased cell and insert fresh new ones in their place. This procedure is called “chromosome
replacement therapy.”
During this
procedure, your replacement chromosomes are first manufactured to order,
outside of your body, in a clinical benchtop production device that includes a
molecular assembly line. Your individual
genome is used as the blueprint. If the
patient wants, acquired or inherited defective genes could be replaced with
nondefective base-pair sequences during the chromosome manufacturing process,
thus permanently eliminating any genetic disease – including conditions related
to aging. Nanorobots called
chromallocytes [46], each carrying a single copy of the revised chromosomes,
are injected into the body and travel to the target tissue cells. Following powered cytopenetration and
intracellular transit to the nucleus, the chromallocytes remove the existing
chromosomes and then install the properly methylated replacement chromosomes in
every tissue cell of your body (requiring a total dose of several trillion
nanorobots), then exit the cell and tissue, re-enter the bloodstream, and
finally eliminate themselves from the body through the kidneys.
5. Dechronification: A Treatment for the Disease of Natural Death
The end
result of all these nanomedical advances will be to enable a process I call
“dechronification” – or, more colloquially, “rolling back the clock.” I see no serious ethical problems with
this. According to the volitional
normative model of disease that is most appropriate for nanomedicine [30], if
you’re physiologically old and don’t want to be, then for you, oldness and
aging – and natural death – are a disease, and you deserve to be cured. After all, what’s the use of living many
extra hundreds of years in a body that lacks the youthful appearance and vigor
that you desire?
Dechronification
will first arrest biological aging, then reduce your biological age by
performing three kinds of procedures on each one of the 4 trillion tissue cells
in your body:
First, a
respirocyte- or microbivore-class device will be sent to enter every tissue
cell, to remove accumulating metabolic toxins and undegradable material. Afterwards, these toxins will continue to
slowly re-accumulate as they have all your life, so you’ll probably need a
whole-body cleanout to prevent further aging, maybe once a year.
Second,
chromosome replacement therapy can be used to correct accumulated genetic
damage and mutations in every one of your cells. This might also be repeated annually, or less
often.
Third, persistent
cellular structural damage that the cell cannot repair by itself such as
enlarged or disabled mitochondria can be reversed as required, on a cell by
cell basis, using cellular repair devices.
We’re still a long way from having complete theoretical designs for many
of these machines, but they all appear possible in theory. By the time our molecular manufacturing
capability progresses to the degree necessary to begin building medical
nanorobots, probably in the next 10-20 years, we will have good designs for
cell repair devices.
The net
effect of these interventions will be the continuing arrest of all biological
aging, along with the reduction of current biological age to whatever new
biological age is deemed desirable by the patient, severing forever the link
between calendar time and biological health.
These interventions may become commonplace, several decades from today.
Using
annual checkups and cleanouts, and some occasional major repairs, your
biological age could be restored once a year to the more or less constant
physiological age that you select. I see
little reason not to go for optimal youth – though trying to maintain your body
at the ideal physiological age of 10
years old might be difficult and undesirable for other reasons. A rollback to the robust physiology of your
late teens or early twenties would be easier to maintain and much more
fun. That would push your Expected Age
at Death up to around 700-900 calendar years (Figure 18). You might still eventually die of accidental
causes, but you’ll live ten times longer than you do now.
Figure 18. Expected age at death after dechronification
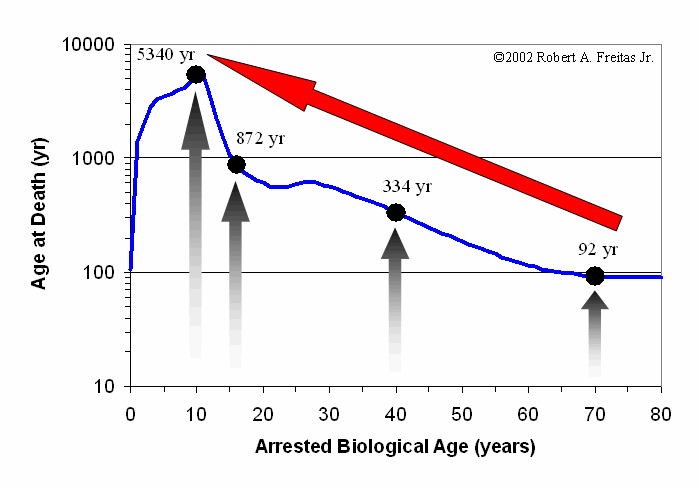
How far can
we go with this? Well, if we can
eliminate 99 percent of all medically preventable conditions that lead to
natural death [2], your healthy lifespan – or healthspan – should increase to
about 1100 years (Table 3). It may be
that you’ll find it hard to coax more than a millennium or two out of your
original biological body, because deaths from suicides and accidents have
remained stubbornly high for the last 100 years, falling by only one-third
during that time. But our final victory
over the scourge of natural biological death, which we shall achieve later in
this century, should extend the healthspan of normal human beings by at least
ten- or twenty-fold beyond its current maximum length.
Table 3. Nanomedical Limits to Human Biological Healthspan following the Nanomedical Conquest of Natural Death
Current Cause of Death Cumulatively Eliminated |
Net Remaining Death Rate (deaths per person-year) |
Expected Age at Death (calendar years) |
|
NONE (death rates same as
in Year 2000) 10% of medically preventable conditions eliminated 50% of medically preventable conditions eliminated 90% of medically preventable conditions eliminated 99% of medically
preventable conditions
eliminated 99% of vehicular accidents eliminated 99% of suicides, homicides, executions eliminated Age-arrested body of 10-year-old boy in Year 2000 99% of non-vehicular accidents eliminated
|
0.008647 0.007837 0.004595 0.001353 0.000624 0.000465 0.000286 0.000130 0.000086
|
80 88 151 512 1,110 1,490 2,420 5,340 8,000 |
One can
hope that the rate of suicides might be greatly reduced, with so much to look
forward to, and with new nanomedical treatments for debilitating mental states
becoming available. Nanotechnology can
also improve the overall safety of our material environment – e.g., by making
possible virtually crash-free, crash-safe cars and aircraft, buildings
(including houses) that incorporate active safety devices, advanced
nanomedicine for severe trauma anticipation and recovery, and the like –
leading to vastly fewer deaths from accidents.
Finally, genetic modifications or nanomedical augmentations to the human
body [47] may extend healthy lifespans still further, to a degree that cannot
yet be accurately predicted.
Notes and References
1.
This chapter was adapted and updated from a lecture entitled “Death is
an Outrage!”, delivered by the author at the Fifth Alcor Conference on Extreme
Life Extension, Newport Beach, CA, on 16 November 2002.
2. “Table 105.
Deaths and Death Rates by Selected Causes: 1990 to 1998,” Vital Statistics, Statistical
Abstract of the
3. “Table 1327.
Population by Country: 1990 to
2010,” Comparative International Statistics, Statistical Abstract of the
4. “Table 1330.
Vital Statistics by Country: 2001
and 2010,” Comparative International Statistics, Statistical Abstract of the
5.
Norris McWhirter, Ross McWhirter, eds., The 1974 Guinness Book of World
Records, Revised American Edition, Sterling Publishing Co.,
6.
The 1994 Information Please Almanac, Atlas and Yearbook, 47th Edition,
Houghton Mifflin Company,
7.
Combatant deaths included 136,858 South Koreans, 54,268 Americans, and
3,687 other UN soldiers, or 194,813 combatants (“The Korean War: Forgotten No
More,” http://www.koreasociety.org/MAIN/KWarConferenceRpt/KW_Abstracts7.htm),
plus up to 2-3 million civilians in both North and South Korea (Jon Halliday,
Bruce Cumings, Korea: The Unknown War, Pantheon Books, New York, 1988, p.
200; see also “Korea: The Right War? At
What Price?” Digital History, http://www.digitalhistory.uh.edu/historyonline/con_korea.cfm).
8.
R.J. Rummel, Death By Government, Transaction Publishers, New Brunswick,
NJ, 1994, p. 4 (a), pp. 48-50 (b), p. 60 (c), p. 70 (d), p. 148 (e).
9.
Contemporaneous media reports, December 2003 – January 2004.
10.
“Fascinating Facts About the Library of Congress,” The Library of
Congress website; http://www.loc.gov/homepage/fascinate.html
11. “Exceptional Returns: The Economic Value of
America’s Investment in Medical Research,” Funding First Reports, Lasker
Medical Research Network, Lasker Foundation, May 2000, p. 5; http://www.laskerfoundation.org/reports/pdf/exceptional.pdf
12.
Kevin M. Murphy, Robert Topel, “The Economic Value of Medical Research,”
Funding First Reports, Lasker Medical Research Network, Lasker Foundation,
March 1998, revised September 1999; http://www.laskerfoundation.org/reports/pdf/economicvalue.pdf
13.
Jennifer Cheeseman Day, “Table 2.
Projections of the Population, by Age, Sex, Race, and Hispanic Origin,
for the
14. “Table 98.
Expectation of Life and Expected Deaths by Race, Sex, and Age: 1998,” Vital Statistics, Statistical Abstract
of the
15.
James W. Vaupel, J.R. Carey, K. Christensen, T.E. Johnson, A.I. Yashin,
N.V. Holm, I.A. Iachine, V. Kannisto, A.A. Khazaeli, P. Liedo, V.D. Longo, Y.
Zeng, K.G. Manton, J.W. Curtsinger, “Biodemographic trajectories of longevity,”
Science 280(8 May 1998):855-860.
16.
U.S. national net worth in current dollars was $20.0141 trillion in 1994
(“Table B.11 Domestic Wealth with Tangible Assets at Current Cost, Year-End
Outstandings,” Balance Sheets for the U.S. Economy, 1945-1994, Release C.9,
Flow of Funds, 8 June 1995, Board of Governors of the Federal Reserve System,
Washington, DC, 1995, p. 7); applying a
+3%/yr inflation factor and a +2%/yr real growth rate during 1995-2000 (Federal
Reserve Bulletins, 1995-2000) yields an estimate for U.S. national net worth of
$26.82 trillion in the year 2000.
17. The 2000
18.
The 1999 GDP for 197 countries was $27.5769 trillion in constant 1990
dollars, according to: “Table B2. World
Gross Domestic Product at Market Exchange Rates, 1990-1999,” Department of
Energy (DOE); http://www.eia.doe.gov/emeu/iea/tableb2.html. Using Census Bureau data [17] to estimate the
world GDP deflator, this figure for world GDP is estimated as equivalent to
$33.7080 trillion in constant year 2000 dollars, for the year 2000.
19.
Cumulative summation of year-by-year population estimates interpolated
from the Kremer Series yields estimate of 34.5355 billion people that have
lived from 25,000 BC to 2000 AD; a more
expansive definition of “human” produces a similar cumulative estimate of
59.5522 billion “human” individuals that have ever lived since 1,000,000
BC. See the Kremer Series in: Michael Kremer, “Population Growth and
Technical Change, One Million B.C. to 1990,” Quarterly Journal of Economics
108(August 1993):681-716.
20.
Data for years 1850-1895 for At Birth, Age 40, and
Age 70 are for all males in
21.
The report by Edwin Chadwick, “Sanitary Conditions of the Labouring
People of Great Britain,” submitted to the Council of London in 1842, ushered
in the Great Sanitation Revolution in the Western world, e.g., the Public
Health Acts of 1845 and 1875 in
22.
For example, deaths among children under age 15 fell from 90 per 100,000
in 1895 to 30 per 100,000 in 1925, due to the introduction of diphtheria
vaccine; source: T. McKeown, The Role of Medicine: Dream, Mirage, or Nemesis?, Princeton
University Press, Princeton, New Jersey, 1979.
See chart in: Robert A. Freitas
Jr., “Figure 1.2,” Nanomedicine, Volume I:
Basic Capabilities, Landes Bioscience,
23.
Antibiotics were widely introduced in the
24.
Data for years 1860-1895 are for all males in
25.
Data for years 1850-1895 for At Birth are for all males in
26.
J.R. Carey. P. Liedo, D. Orozco, J.W. Vaupel, “Slowing of mortality
rates at older ages in large medfly cohorts,” Science 258(16 October
1992):457-461.
27.
Data for years 1865-1895 are for all persons in
28.
“Table 107. Death by Selected
Causes and Selected Characteristics:
1998,” Vital Statistics, Statistical Abstract of the
29.
Data from: “Series A
119-134. Population, by Age, Sex, Race,
and Nativity: 1790 to 1970,” Population, Historical Statistics of the
30.
Robert A. Freitas Jr., “Section 1.2.2 Volitional Normative Model of
Disease,” Nanomedicine, Volume I: Basic
Capabilities, Landes Bioscience,
31.
A.D. de Grey, B.N. Ames, J.K. Andersen, A. Bartke, J. Campisi, C.B.
Heward, R.J. McCarter, G. Stock, “Time to talk SENS: critiquing the
immutability of human aging,” Annals of the New York Academy of Sciences
959(April 2002):452-462, 463-465 (discussion);
A.D. de Grey, J.W. Baynes, D. Berd, C.B. Heward, G. Pawelec, G. Stock,
“Is human aging still mysterious enough to be left only to scientists?”
Bioessays 24(July 2002):667-676, Bioessays 25(January 2003):93-95
(discussion); A.D. de Grey, “An
engineer’s approach to the development of real anti-aging medicine,” Sci. Aging
Knowledge Environ. 2003(8 January 2003):VP1;
A.D. de Grey, “Challenging but essential targets for genuine anti-aging
drugs,” Expert Opinion Therapeutic Targets 7(February 2003):1-5.
32.
Richard A. Miller, “Extending life: scientific prospects and political
obstacles,” Milbank Quarterly 80(March 2002):155-74; A.D. de Grey, “The foreseeability of real
anti-aging medicine: focusing the debate,” Experimental Gerontology.
38(September 2003):927-934.
33.
Robert A. Freitas Jr., “Section 2.4.1 Molecular Mechanical Components,”
Nanomedicine, Volume I: Basic
Capabilities, Landes Bioscience,
34.
T. Cagin, A. Jaramillo-Botero, G. Gao, W.A. Goddard III, “Molecular
mechanics and molecular dynamics analysis of Drexler-Merkle gears and neon
pump,” Nanotechnology 9(September 1998):143-152; http://www.wag.caltech.edu/foresight/foresight_1.html
35.
K.E. Drexler, R.C. Merkle, “Simple pump selective for neon”, Institute
for Molecular Manufacturing (IMM) website;
http://www.imm.org/Parts/Parts1.html
or http://www.imm.org/Images/pumpApartC.jpg
36.
Ralph C. Merkle, Robert A. Freitas Jr., “Theoretical analysis of a
carbon-carbon dimer placement tool for diamond mechanosynthesis,” Journal of Nanoscience and
Nanotechnology 3(June 2003):319-324; http://www.rfreitas.com/Nano/JNNDimerTool.pdf
37.
Jingping Peng, Robert A. Freitas Jr., Ralph C. Merkle, “Theoretical
Analysis of Diamond Mechanosynthesis.
Part I. Stability of C2
Mediated Growth of Nanocrystalline Diamond C(110) Surface,” Journal of Computational
and Theoretical Nanoscience 1(March 2004);
David J. Mann, Jingping Peng, Robert A. Freitas Jr., Ralph
C. Merkle, “Theoretical Analysis of Diamond Mechanosynthesis. Part II.
C2 Mediated Growth of Diamond C(110) Surface via Si/Ge-Triadamantane
Dimer Placement Tools,” Journal of Computational and Theoretical Nanoscience 1(March 2004).
38.
Robert A. Freitas Jr., Ralph C. Merkle, Diamond Surfaces and Diamond
Mechanosynthesis, Landes Bioscience, Georgetown, TX, 2005. In preparation.
39.
Ralph C. Merkle, Eric G. Parker, George D. Skidmore, “Method and system
for self-replicating manufacturing stations,” United States Patent No.
6,510,359, 21 January 2003.
40. Robert A. Freitas Jr., Ralph
C. Merkle, Kinematic Self-Replicating Machines, Landes Bioscience, Georgetown, TX, 2004. In press.
41.
Robert A. Freitas Jr., “Exploratory design in medical nanotechnology: A
mechanical artificial red cell,” Artificial Cells, Blood Substitutes, and Immobilization Biotechnology 26(1998):411-430; http://www.foresight.org/Nanomedicine/Respirocytes.html. Images available at Nanomedicine Art Gallery,
Foresight Institute website: http://www.foresight.org/Nanomedicine/Gallery/Species/Respirocytes.html
42.
Lawrence Fields, Jillian Rose, “Animation
of a respirocyte (an artificial red blood cell) being injected into the bloodstream,”
PBS documentary “Beyond Human,” air date 15 May 2001, Phlesch Bubble
Productions website; http://www.phleschbubble.com/album/beyondhuman/respirocyte01.htm
43.
A brief summary description may be found at: Robert A. Freitas Jr., “Microbivores:
Artificial Mechanical Phagocytes,” Foresight Update, No. 44, 31 March
2001, pp. 11-13; http://www.imm.org/Reports/Rep025.html. The full technical paper is at: Robert A. Freitas Jr., “Microbivores:
Artificial Mechanical Phagocytes using Digest and Discharge Protocol,” Zyvex
preprint, March 2001, Robert A . Freitas Jr. website; http://www.rfreitas.com/Nano/Microbivores.htm. Images available at Nanomedicine Art Gallery,
Foresight Institute website: http://www.foresight.org/Nanomedicine/Gallery/Species/Microbivores.html
44.
Robert A. Freitas Jr., “Section 15.4.2.3 Geometrical Trapping in Spleen
Vasculature,” Nanomedicine, Volume IIA:
Biocompatibility, Landes Bioscience,
45.
K. Eric Drexler, “Section 13.4.1
A bounded-continuum design for a stiff manipulator,” Nanosystems: Molecular Machinery, Manufacturing, and
Computation, John
46. Robert A. Freitas Jr.,
“Chromallocytes: Cell Repair Nanorobots
for Chromosome Replacement Therapy,” 2004; in preparation.
47.
Robert A. Freitas Jr., Christopher J. Phoenix, “Vasculoid: A personal
nanomedical appliance to replace human blood,” Journal of Evolution and Technology
11(April 2002); http://www.jetpress.org/volume11/vasculoid.html
[All websites accessed 6 January
2004]